
Introduction to Trailmaker™
Getting started with your single cell RNA-sequencing (scRNA-seq) data analysis doesn’t have to be daunting! Trailmaker guides you through the end-to-end analysis of your Evercode™ data, taking you from FASTQ files to figures in just a few simple clicks. You can gain unprecedented insight into the cellular heterogeneity of complex biological systems and drive forward your research programme.
Visit our website or watch an in-depth demo of Trailmaker in action.
Trailmaker is available for free to all Parse customers and to all academic users.
Table of Contents
- Getting started
- Sample Loading Table module
- Pipeline module
- Automatic integration of Pipeline & Insights modules
- Insights module
- Insights module - Data Processing tab
- How it works
- Automated data processing
- Data processing status indicator
- Navigating through the data processing steps
- Data processing plots and statistics
- Data Processing steps
- Data Processing for immune repertoire analysis
- Adjusting a data processing setting
- Data Processing failures
- Saving a processed project
- Exporting the data processing plots
- Downloading the data processing settings
- Summary of Insights Data Processing tab
- Data Exploration
- Navigation
- Cell sets and Metadata tile
- Performing automatic annotation
- Creating custom cell sets
- Subset selected cell sets to a new project
- UMAP or t-SNE embedding tile
- Heatmap
- Gene list
- Differential expression analysis
- Pathway enrichment analysis
- PantherDB
- Enrichr
- Data Exploration for immune repertoire analysis
- Plots and Tables
- Citing Trailmaker
- Deleting data from Trailmaker
Automatic integration of Pipeline & Insights modules
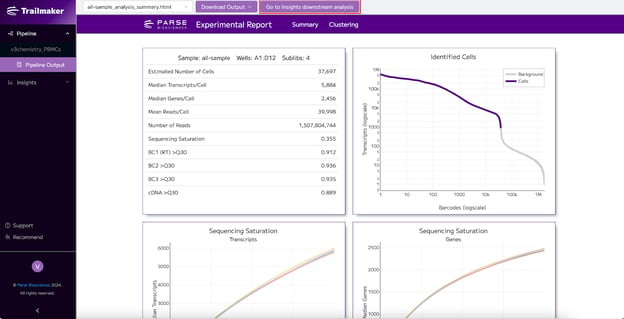
The outputs of successful pipeline runs are automatically sent to the Insights module for downstream analysis and visualization. Simply click the “Go to Insights downstream analysis” button to navigate to the Data Processing tab of the Insights module where you can begin to deep dive into your dataset.
After release of support for paired WT and immune profiling data in Trailmaker Insights module (22nd January 2026) and immune only Insights support (9th March 2026), successful immune pipeline Runs will automatically generate an Insights module project containing both the WT and immune data that will be linked from the Pipeline Outputs page. Note that paired WT+immune Runs that completed prior to this release date will have a linked Insights module project containing ONLY the WT data.
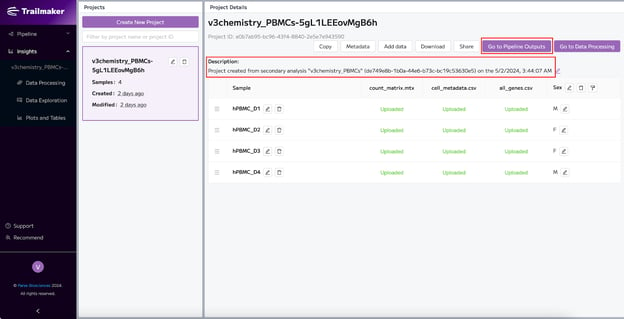
From the Insights module, when a project has been generated automatically from a Pipeline run, you can navigate back to view the pipeline run outputs using the ‘Go to Pipeline Outputs’ button. The details of the related Pipeline Run are provided in the project description.
Note that poor quality samples that contain few cells (< 10 cells with ≥ 30 transcripts) are not sent from the Pipeline Outputs page to the Insights module.
Combining multiple Pipeline Runs into a single Insights Project
The outputs from multiple Pipeline Runs containing WT data can be combined into a single Insights Project by downloading the unfiltered count matrices from the Pipeline Outputs pages for each relevant Run, and then uploading all relevant count matrices to a single Project within the Insights module. For immune Runs without WT parent data, the filtered count matrices should be used.
Citing Trailmaker
For guidance on citing Trailmaker in a publication, see our article: How to use and cite Trailmaker in a publication.
Deleting data from Trailmaker
All data, including Sample Loading Tables, Pipeline Runs and Insights Projects can be deleted from Trailmaker by the user. It is necessary to have 'Owner' permissions to delete data from Trailmaker.