Insights module - Data Processing
Overview
Data generated from a single cell RNA-sequencing experiment always requires filtering and cleanup. During data processing, background, dead cells, doublets and poor quality cells are excluded from the downstream analysis. These steps ensure that the processed data are high quality and return accurate results during downstream analysis.
After successfully launching an Insights module project, Trailmaker applies default downstream processing settings in the Data Processing tab to prepare it for analysis and visualization. The automatic default settings that are applied to your dataset enable you to immediately access and explore the first pass of the analysis. All data processing settings can be adjusted to your preferences.
The Insights module Data Processing tab consists of 7 sequential steps. The output of each step in this module becomes the input for the next step. Steps 1-5 consist of filters to remove unwanted and poor quality data from each individual sample. In step 6, multiple sample datasets are integrated to remove batch effects, and dimensionality reduction is performed. Finally, in step 7, the embedding is configured (e.g. UMAP or t-SNE) and clustering is applied.
The filtered, integrated data with clustering is then available for downstream exploration and visualization in the Data Exploration and Plots and Tables tabs within the Insights module.
See also: Guided walkthrough: Insights Data Processing
How it works
For typical projects that contain count matrices generated by the Trailmaker Pipeline module or uploaded directly to the Insights module (e.g. in Parse Biosciences or 10x Genomics format), the data files for each sample are converted into separate Seurat objects. These Seurat objects are processed separately and in parallel for filtering steps 1-5 of Data Processing.
Then in step 6 data integration, the multiple Seurat objects are integrated into a single object. Depending on the selected parameters in step 6 data integration, the project will have either a Seurat object or an Anndata (Scanpy) object. All downstream analysis, from steps 6 and 7 in Data Processing, through to the Data Exploration and Plots and Tables modules, then function using the Seurat or Anndata object. Immune projects utilize Scanpy and a MuData object - see Data Processing for immune repertoire analysis for more details.
See the 'Step 6: Data integration' section below for more details on selecting Seurat or Scanpy options in Trailmaker.
Note that Scanpy is the default for all Parse Biosciences Evercode WT Mega and WT Mega 384 projects as well as all immune projects (TCR or BCR), while Seurat is the default for all other projects.
Automated data processing
Insights module projects undergo downstream processing in the Data Processing tab following automatic trigger from a successful Pipeline Run or from manual upload and trigger from the Insights module Project Details page via the ‘Process Project’ button. The first run of Data Processing uses default settings to dynamically estimate appropriate thresholds for filtering, and standard settings for integration and clustering.
Some minimal filtering parameters are applied automatically to all projects. Specifically:
- Cells with less than 10 features are excluded
- Features that have zero counts are excluded
The automated default Data Processing values are established according either to the current best practice in the field or according to the spread of each sample data. Specific details on the default values for each step in the Data Processing tab are explained fully in the Data Processing Steps section below.
Data Processing status indicator
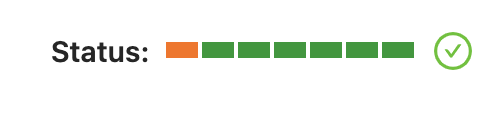
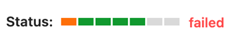
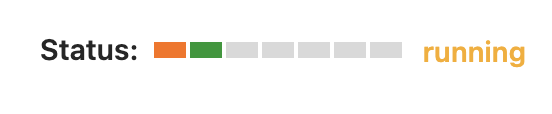
At the top right of the page in the Data Processing tab, there is a status indicator. When data processing is complete, the status indicator will appear green (screenshot A, below), whilst steps that are in progress appear gray (screenshot B). If data processing fails, the indicator will appear incomplete and marked as failed (screenshot C). The step that is currently being viewed is marked in orange (screenshots A-C).
For more information on what to do if data processing fails for your project, see the Data Processing Failures section below.
Note that it is not possible to cancel a Data Processing run that is running.
When samples or metadata details are changed (re-named, added or removed), the Project must be processed again from the Project Details page.
Navigating through the data processing steps
Trailmaker has the following steps in the Data Processing module:
1. Classifier filter
2. Cell size distribution filter
3. Mitochondrial content filter
4. Number of Genes vs transcripts filter
5. Doublet filter
6. Data integration
7. Configure embedding
You can navigate between these filters using the dropdown menu on the top left of the page or the navigation arrows on the top right of the page.
The dropdown menu and the status bar also show if the step is completed or not. Steps with a check mark (✔) to the left are complete; steps with a cross mark (❌) to the left have failed.
Filtering steps (1-5) can be disabled using the ‘Disable’ button at the top of the page. Filtering steps that are disabled are shown in the dropdown menu with the step name in strikethrough.
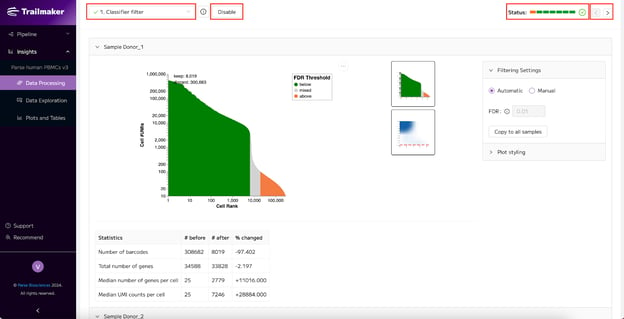
In filtering steps 1-5, the samples available within the project are listed vertically with one plot for each sample. You can scroll through the samples easily. Individual sample plots can be minimized by clicking on the sample name above the plot.
Data processing plots and statistics
For the filtering steps (steps 1-5), data is filtered on a per sample basis. A plot is shown for each individual sample within each filter. Samples can be selected to view/hide using the selection box at the top left. Note that hiding samples from the data processing filter view does not exclude them from the analysis - all samples present in the project are included in the analysis.
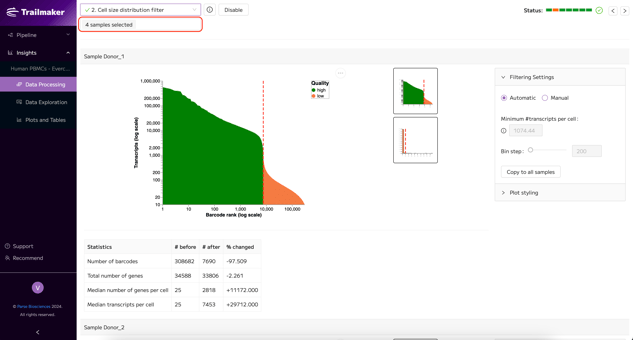
Below each sample plot, there is a table that describes the filtering statistics for each sample: ‘# before’ describes the number of barcodes present in the sample before the current filtering step; ‘# after’ describes the number of barcodes present in the sample after the current filtering step; ‘% changed’ describes the proportion change in barcode number as a result of the current filtering step.
The number of barcodes shown in the first step refers to the number of barcodes present in each sample after initial filtering in Insights Data Processing where cells with fewer than 10 transcripts are removed. After the first active filter, the number of barcodes refers to the filter currently being applied.
The total number of genes is calculated as the number of genes with non-zero counts across all cells.
An example filtering plot and associated statistics table for a single sample in filtering step 4 is shown below as an example:
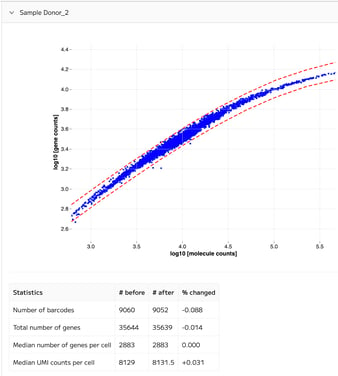
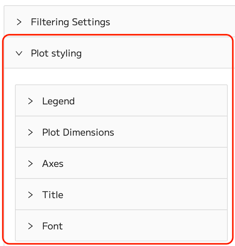
Each plot can be fully customized to your design preferences using the ‘Plot styling’ menu.