Insights module
Overview
The Insights module is where processed data can be filtered, integrated and visualized for deep dive exploration and plotting. This module offers advanced filtering and data cleanup, integration of multi-sample datasets, customization of data visualization and clustering, cluster annotation, and plot customization for the generation of publication-ready figures.
Processed data can enter the Insights module directly from a successful Pipeline Run (in the Pipeline module). Alternatively, processed data files such as count matrices, Seurat objects, etc. can be directly uploaded to this module.
The module offers both Seurat and Scanpy data analysis workflows. Note that Scanpy is the default for all Parse Biosciences Evercode WT Mega, WT Mega 384 and immune profiling (TCR or BCR) projects, while Seurat is the default for WT Mini and WT projects. Seurat/Scanpy selection is controlled in Step 6: Data integration.
In the case of immune (either TCR or BCR) datasets with or without a WT parent, Immune Insights projects are generated automatically following a successful run in Trailmaker’s Pipeline module. Alternatively, immune data with or without WT parent data, can be uploaded directly to the Insights module. All paired WT+immune projects that are processed in the Insights module automatically integrate the WT and immune data, giving researchers a complete view of clonal structure and diversity, and gene expression signatures. Clonotypes and cell types can be visualized on an integrated UMAP, dominant clones can be identified quickly in the frequency and honeycomb plots, and conserved patterns can be detected using motif analysis.
Insights Project Details page
See also: Guided walkthrough: Insights module set-up
Selecting ‘Insights’ in the left side navigation sidebar takes you to the Insights module Project Details page.
A list of all available projects in your account is displayed on this page, along with details about the selected project. Among these details are project name, description, sample list, and associated data and metadata. You can edit existing projects and create new projects on this page.
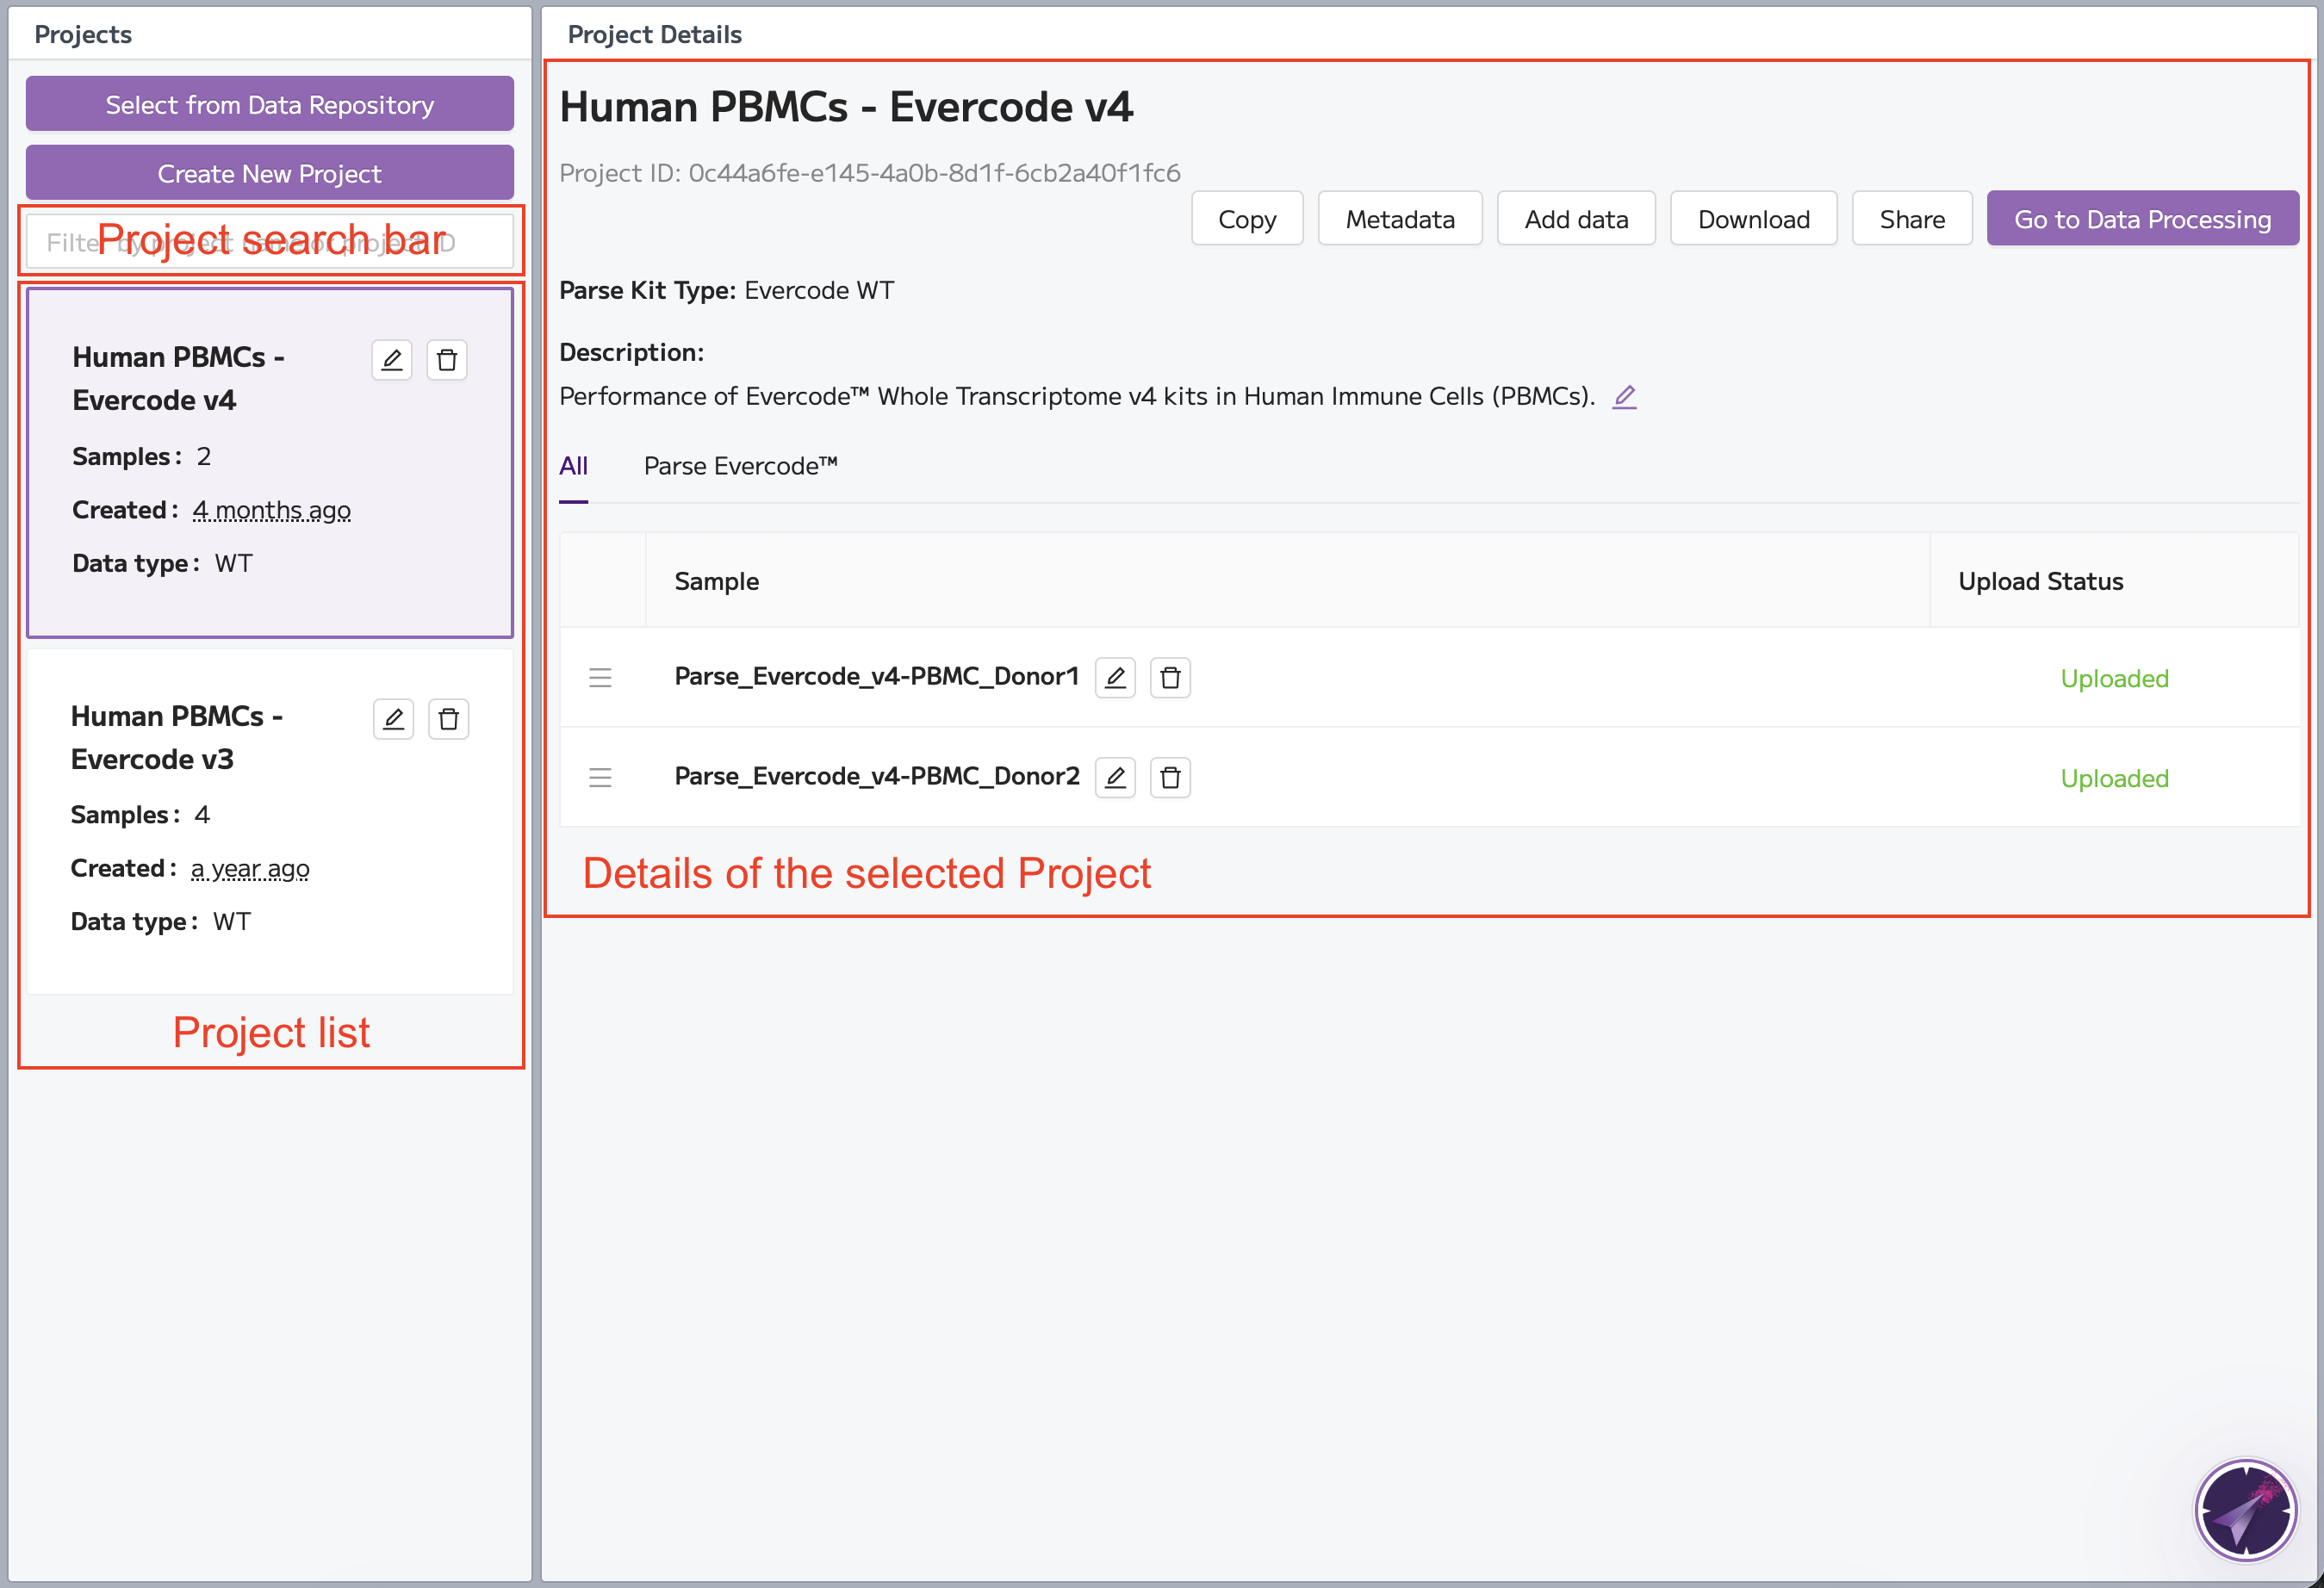
New users will see an empty project list.
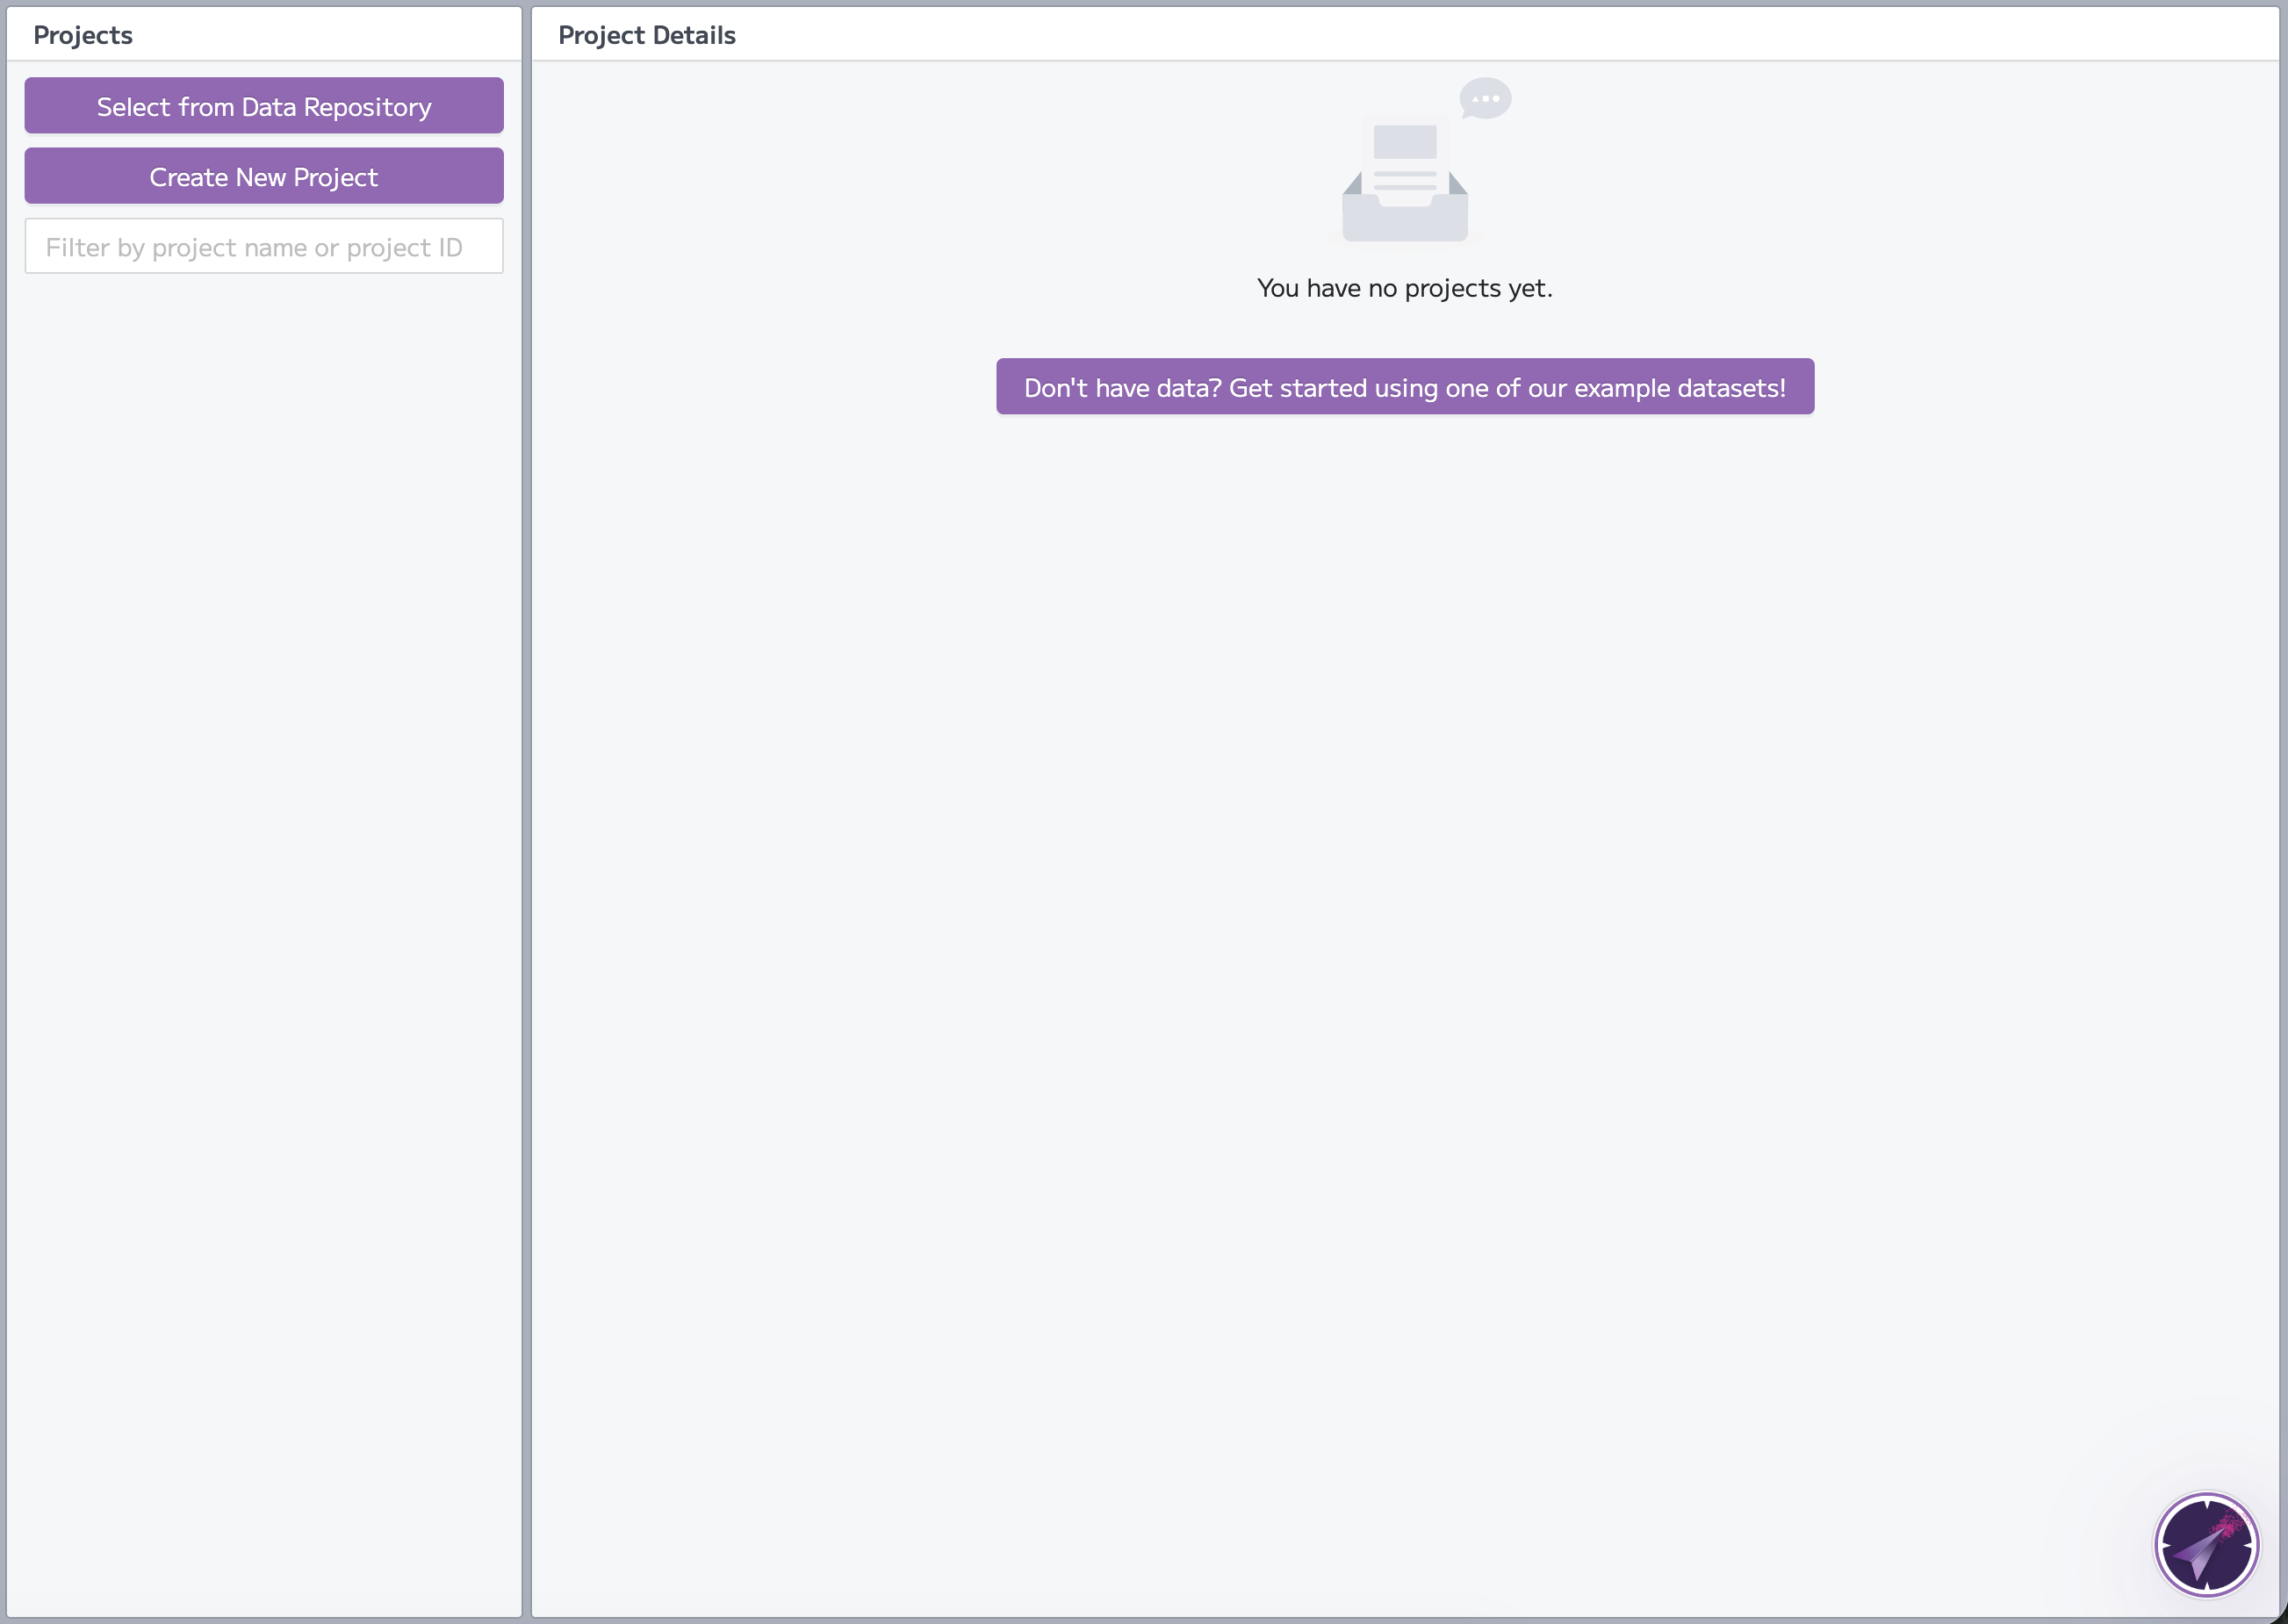
Clicking 'Select from Data Repository' takes you to the data repository where you can select to explore one of the public datasets.
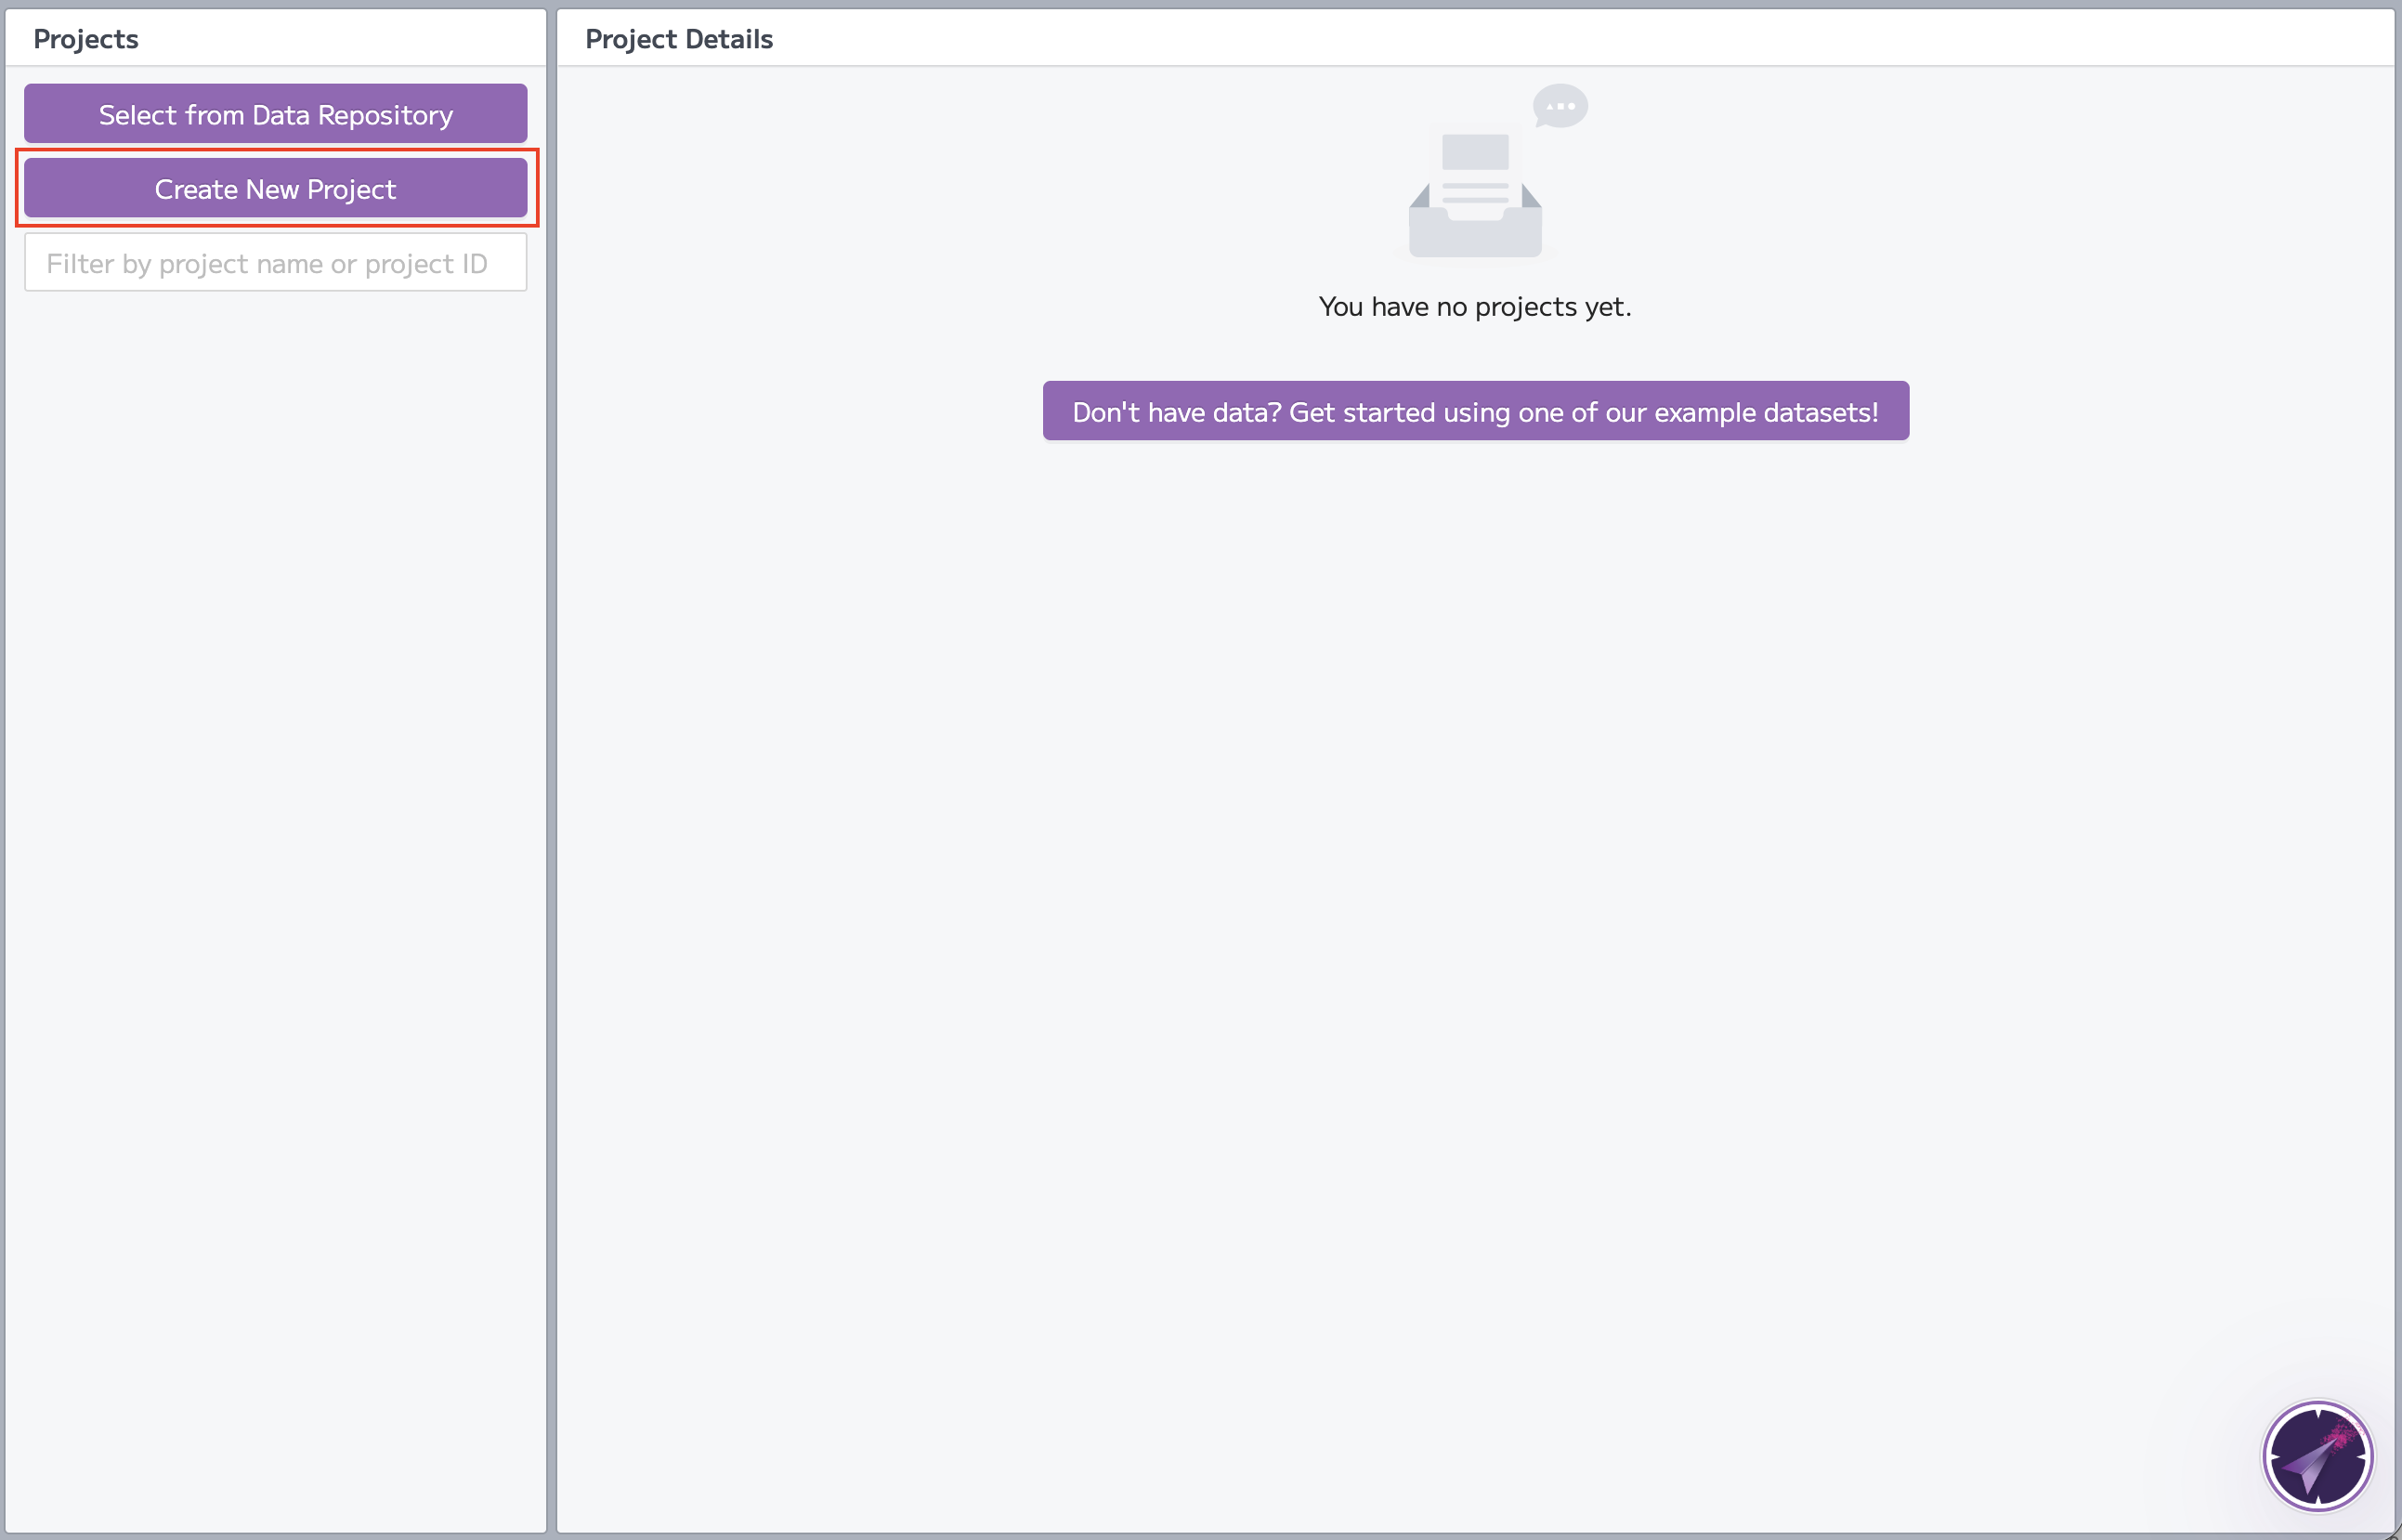
Clicking ‘Create new project’, allows you to upload your own data.
Note that successful Pipeline Runs from the Pipeline module automatically send data to the Insights module for downstream analysis and visualization - see Automatic integration of Pipeline and Insights modules.
Exploring a public dataset from the datasets repository
Trailmaker provides a repository of publicly available datasets that you can use to get started with the platform: https://app.trailmaker.parsebiosciences.com/repository
To access the public dataset repository, use the link above or navigate to the Insights module Project Details page (accessible by clicking 'Insights' on the navigation bar), then click ‘Select from Dataset Repository’.
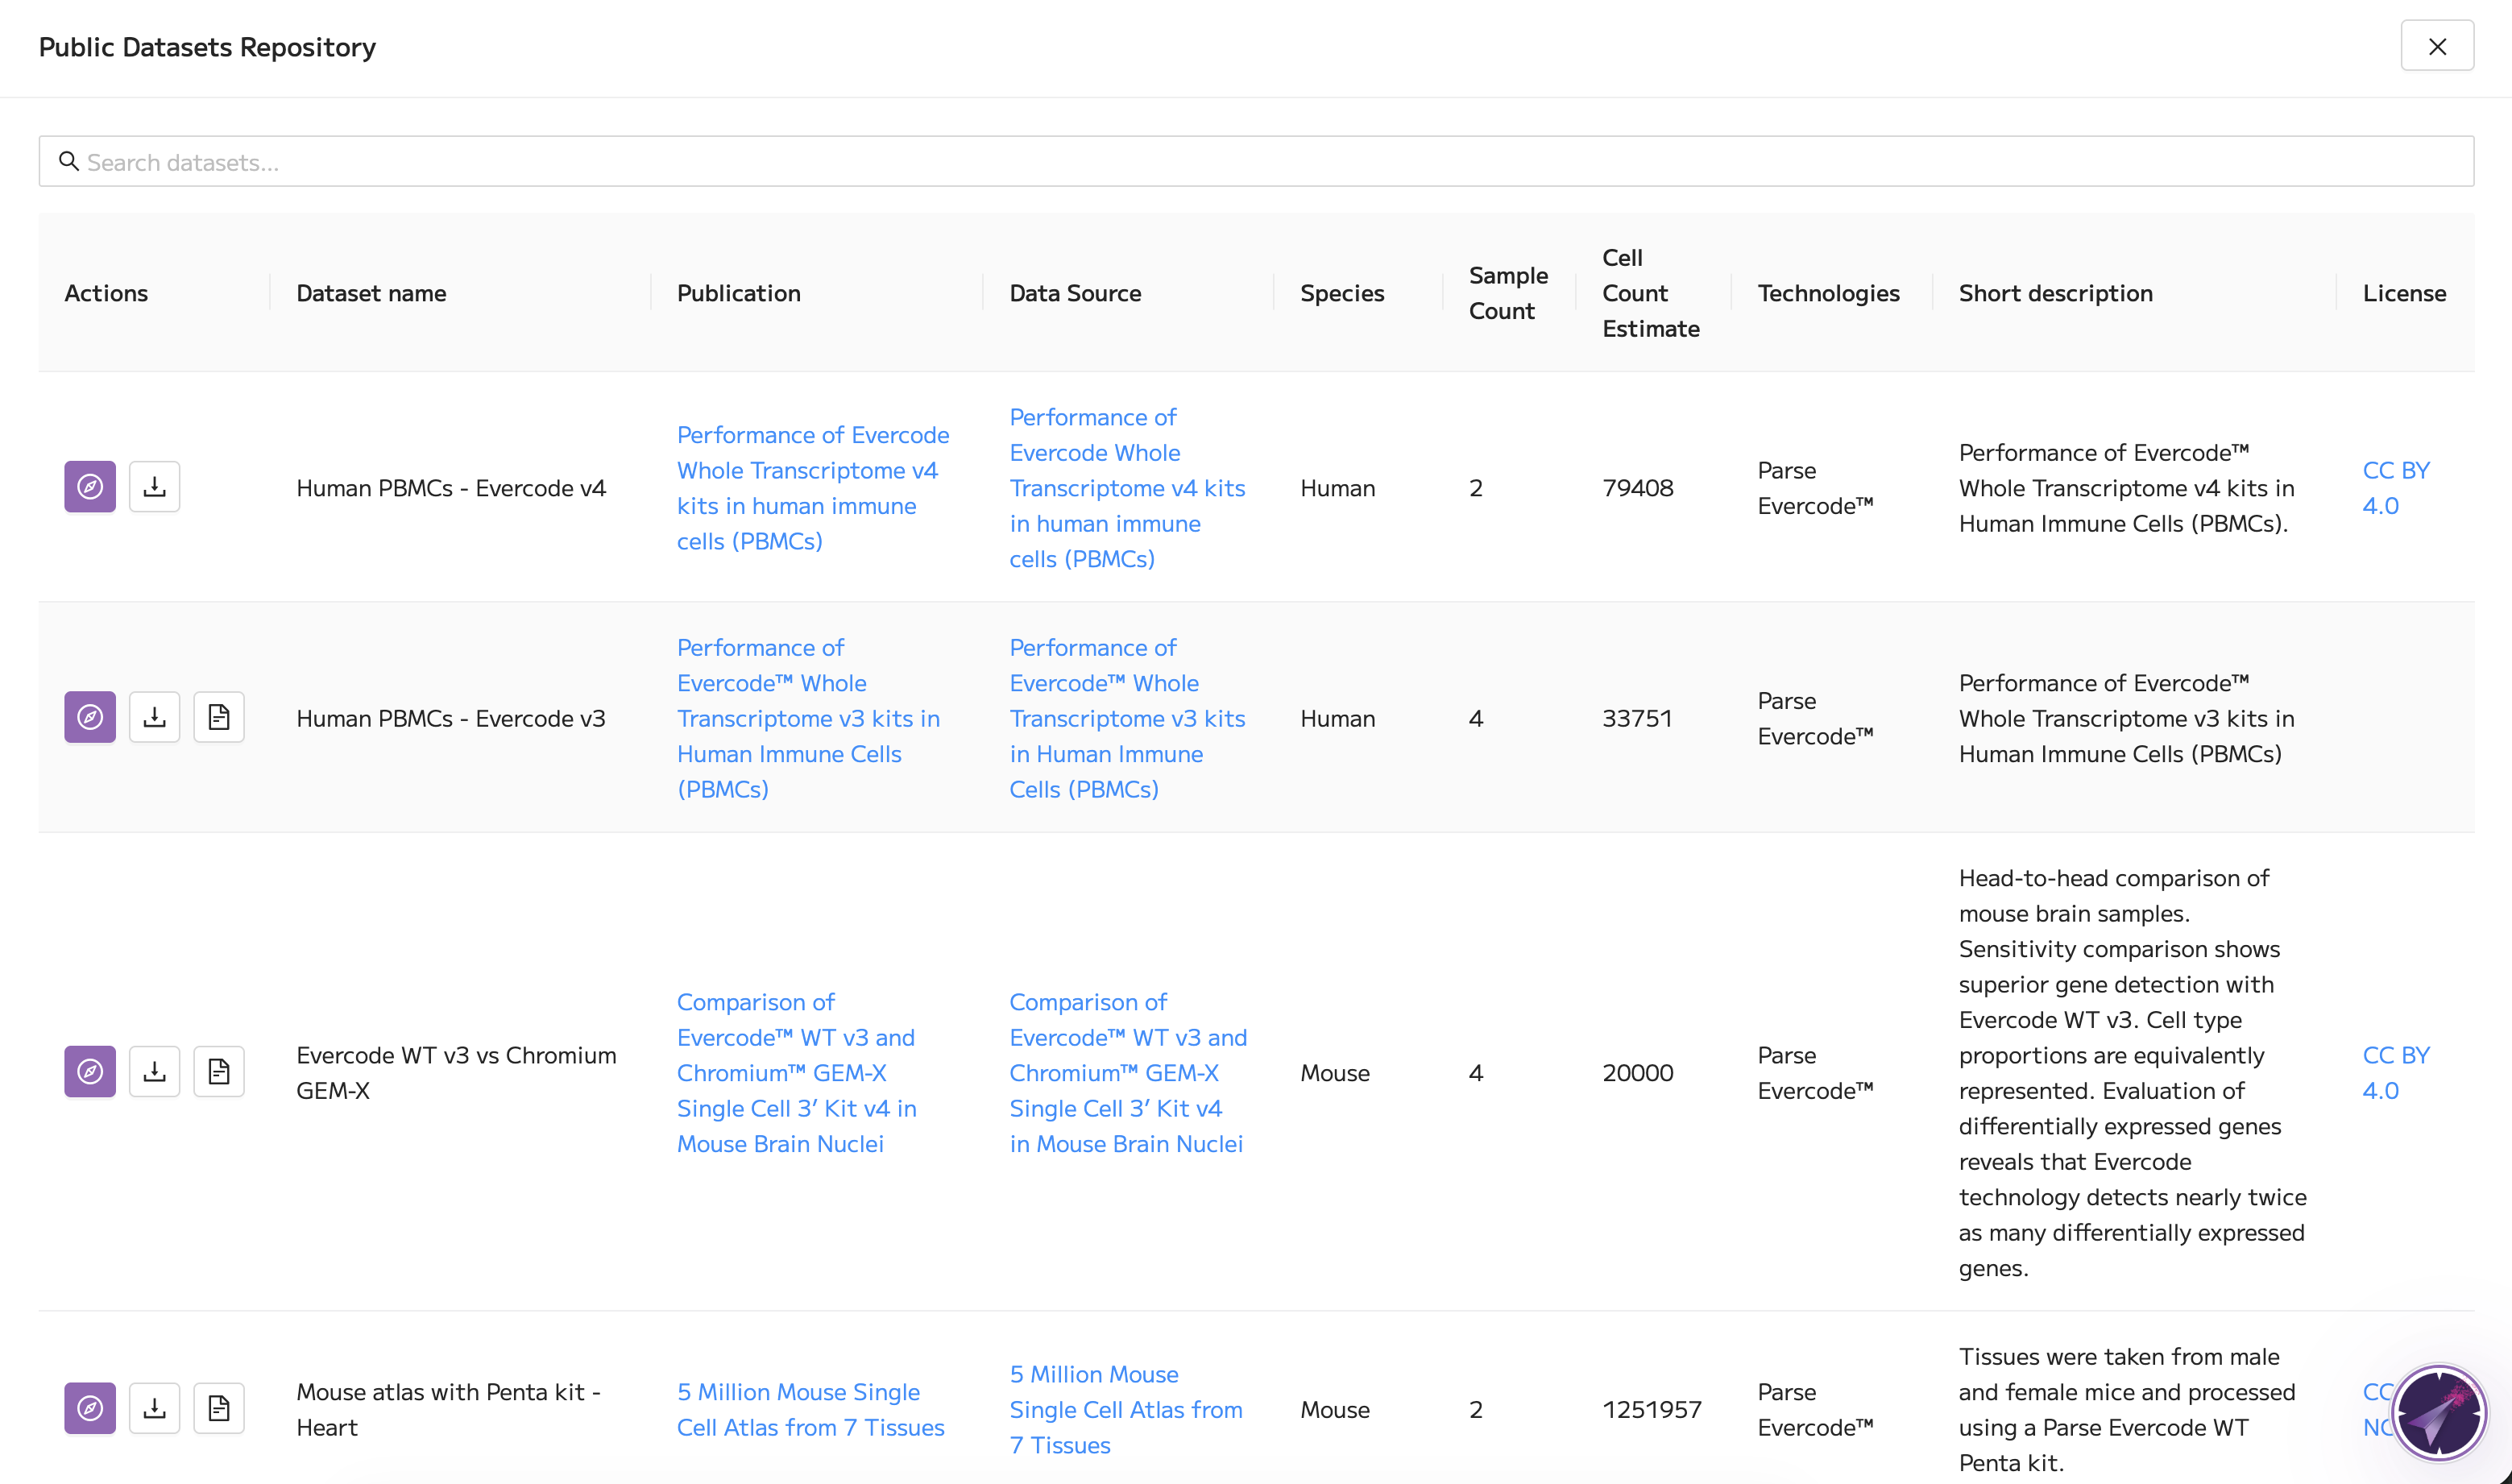
The dataset repository contains ~65 publicly available datasets, totalling >11.5 million cells! You can use these datasets to quickly explore Trailmaker features, validate your findings in an independent single cell dataset, or even integrate them with your own data to increase the power of your analysis.
Use the search bar at the top of the repository to search for key words or specific tissues, fields, species or technologies of interest.
Use the 'Action' buttons to explore or download the selected dataset:
1. Clicking ‘Explore’ on any dataset within the repository opens up a drop-down with two options:
- View: Viewers can explore all aspects of the project including data processing settings and plots, clusters and UMAPs, differential expression and a variety of plot visualizations. However, Viewers cannot change settings or clusters.
You should select this option if you want to quickly explore the platform features and/or project but don't need to make any changes to the project. It's fast to get started but has restricted access. - Copy: By creating a copy, you will become the project Owner. Owners have full control over data processing settings, clusters including the generation of custom clusters, and all changes are saved. Note that copying large projects can take some time.
You should select this option if you want to make changes to the project, such as to Data Processing parameters or clusters. It's slower to get started (due to files being copied) but has access to all functionality in the platform.
2. Clicking 'Download' initiates the download of a zip file containing the count matrices and any associated cell-level metadata for the selected dataset.
3. Clicking 'Pipeline Summary Report', where present, allows you to explore the Pipeline Summary Report for the selected dataset.
See also: How to explore demo datasets from Trailmaker’s dataset repository.
Uploading your own data
Click ‘Create New Project’ to begin uploading your own dataset to Trailmaker:
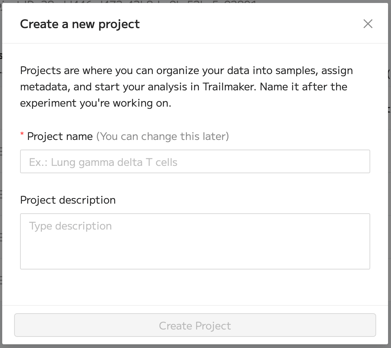
Now, you can name your project and add a project description (optional). Note that the project name must be different from other projects in your account.
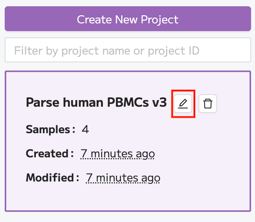
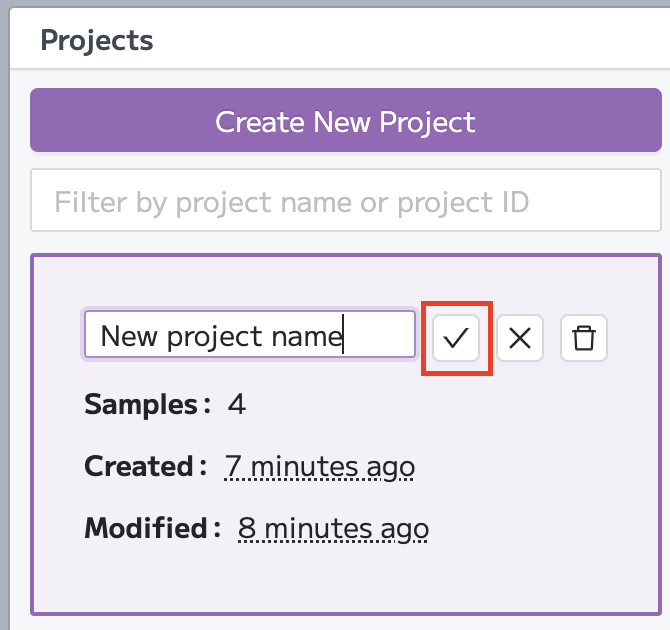
Projects can be easily renamed in the list of projects by clicking on the Edit button next to the project name. Input the new project name and click save.
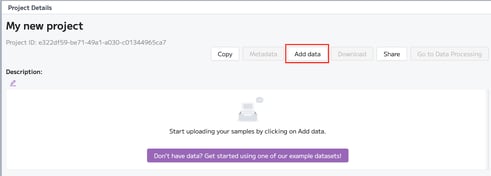
To begin uploading data to your new project, select the ‘Add data’ button. Samples that you want to analyze together should be uploaded to a single project. Samples generated using different technologies can be analyzed together in a single project.
The file format requirements for data upload to the Trailmaker Insights module vary depending on the Technology selection.
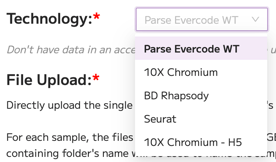
- For Parse Biosciences Evercode WT data that has already been processed using the Pipeline, you should upload the unfiltered count matrices. Using the unfiltered, rather than the filtered, matrices allows user-control over filtering and quality control (QC) clean-up in the Insights module Data Processing page. The unfiltered matrices are stored in the pipeline output folder entitled ‘output_combined’. You can drag and drop a single ‘output_combined’ folder containing multiple sub-folders. For each sample, Trailmaker will automatically select the unfiltered count matrices stored in ‘DGE_unfiltered’. For each sample, you should have the following 3 files: all_genes.csv; cell_metadata.csv and count_matrix.mtx or DGE.mtx. The files are usually in gzip format i.e. ending in .gz. Note that the all-samples unfiltered count matrices are not currently supported.
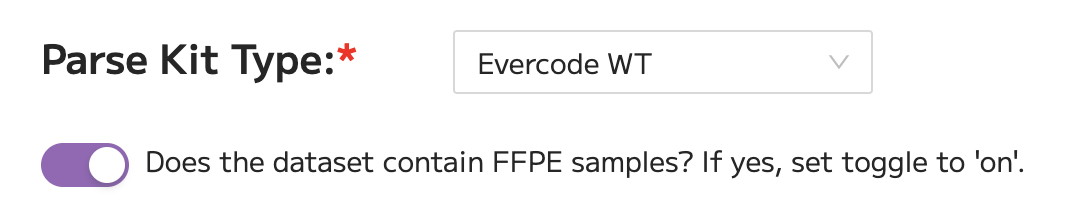
- For samples processed using a Parse Biosciences Evercode WT FFPE kit, the file format instructions detailed in the previous bullet point apply. In the case of FFPE samples, ensure the FFPE toggle is set to 'on' when uploading the data files.
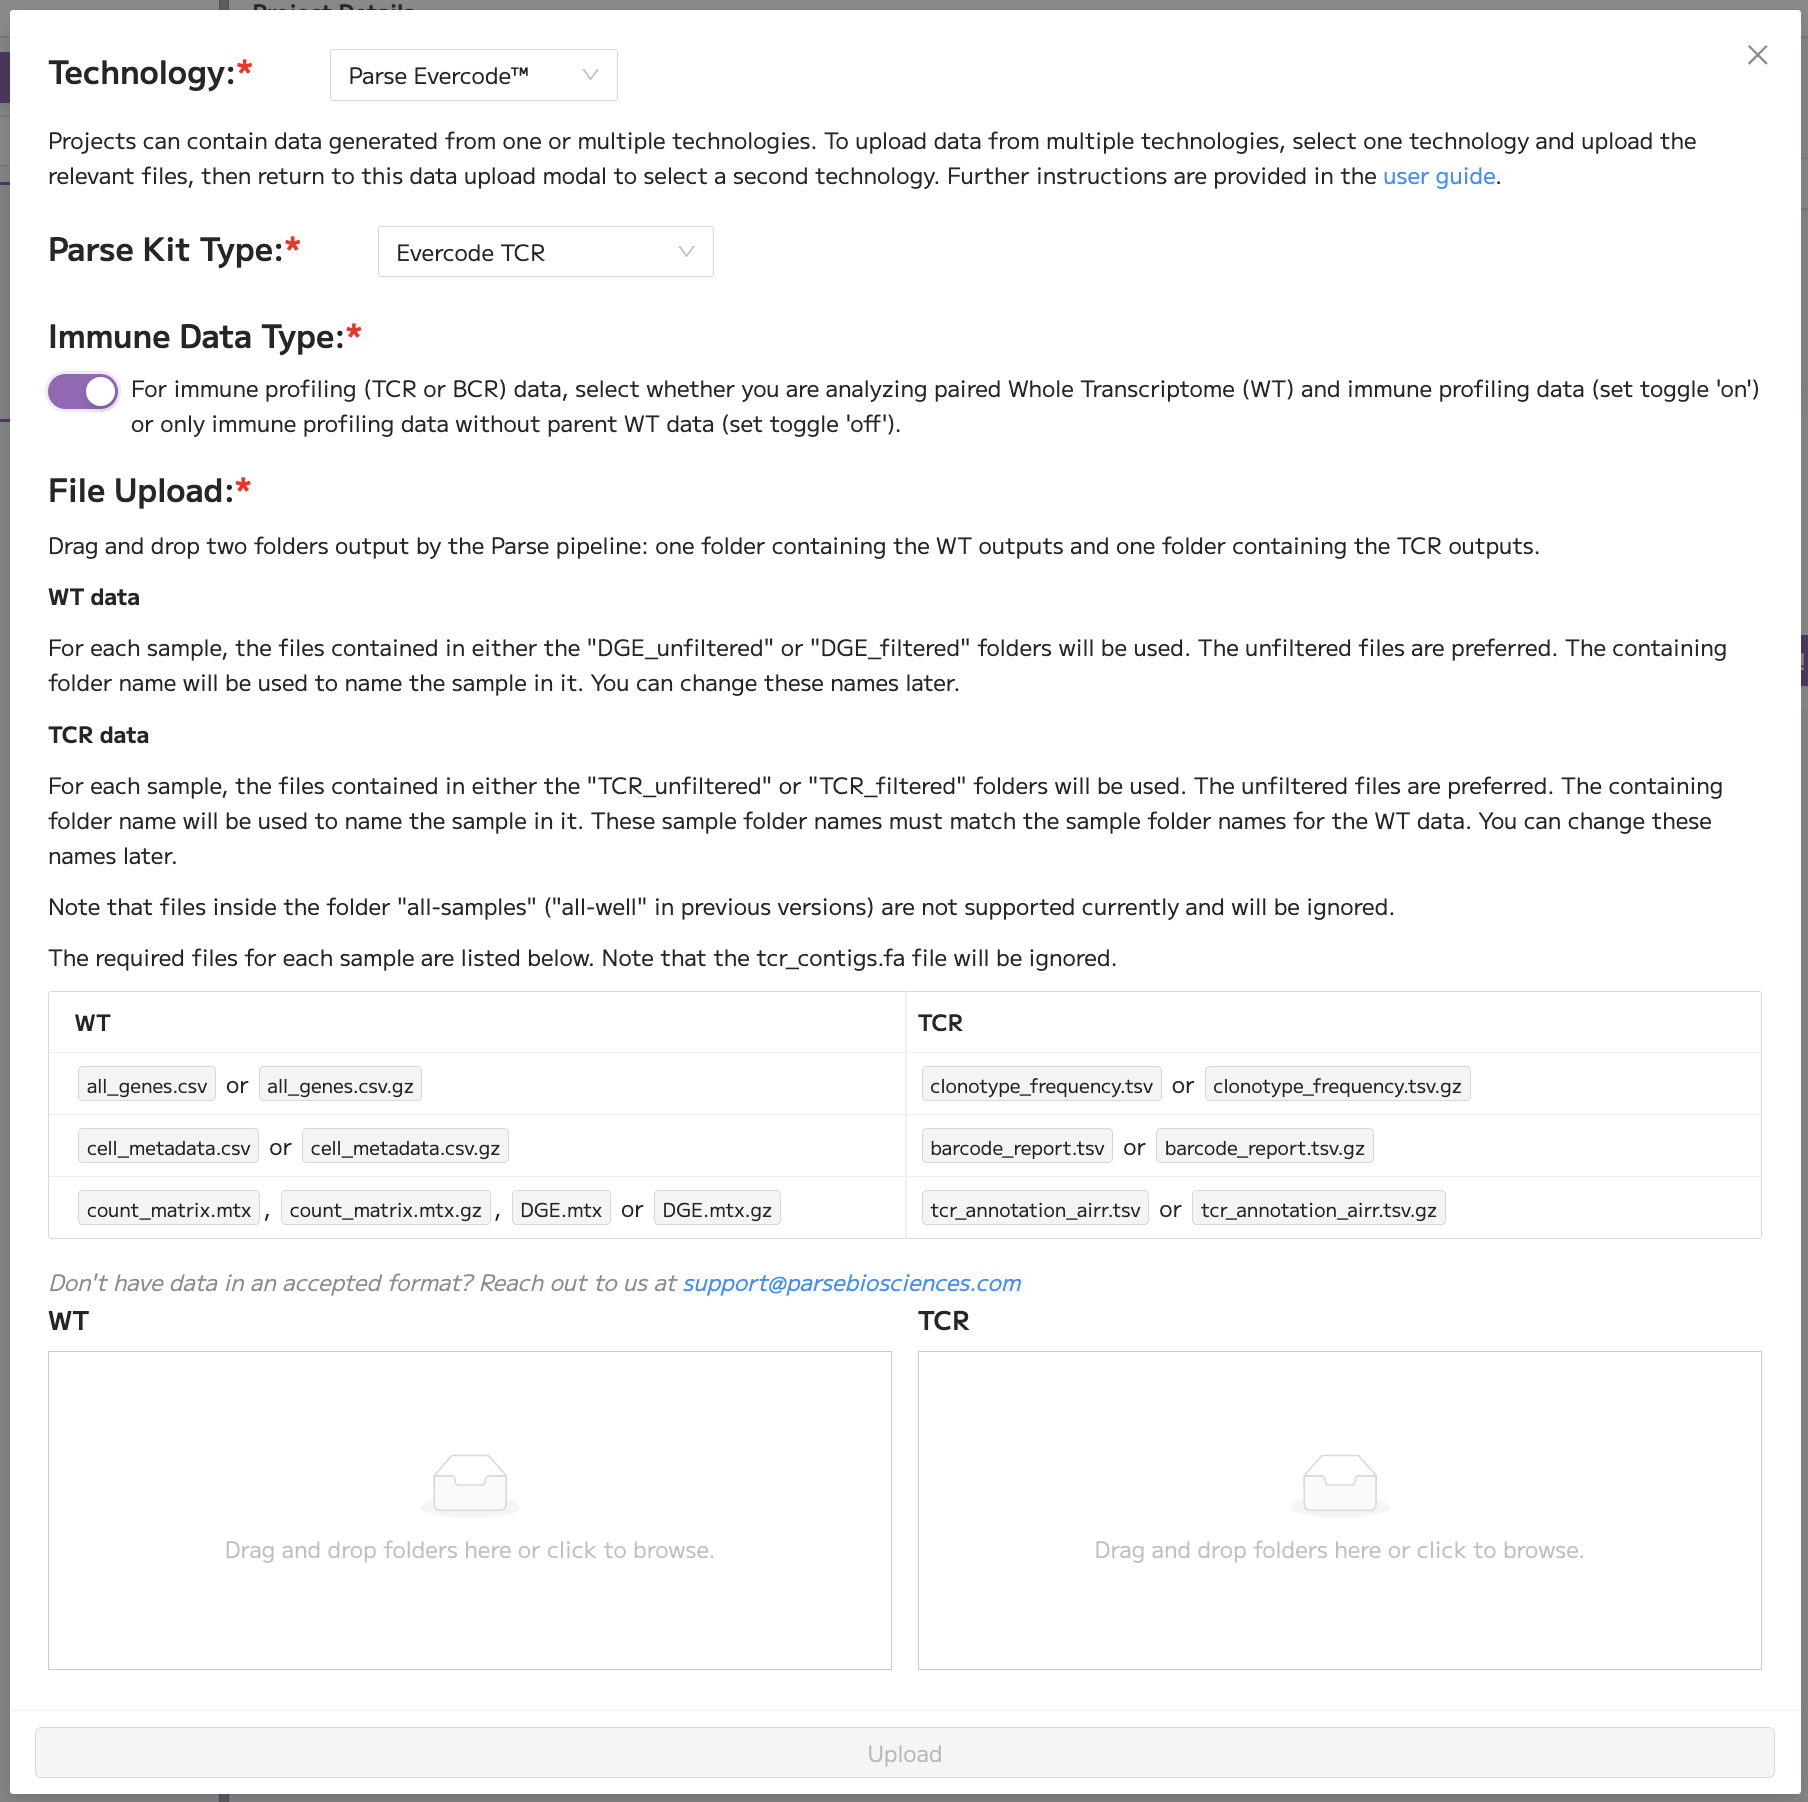
- For Parse Biosciences Evercode TCR or BCR data, the required files depend on whether the immune data is being processed with or without WT parent data.
- For paired WT+immune data, you should upload the unfiltered count matrices for both WT and immune. The WT file requirements are listed in the previous bullet point. The immune files are stored in the pipeline outputs folder entitled ‘immune_output_combined’. You can drag and drop a single folder. For each sample, Trailmaker will select the unfiltered count matrices stored in ‘DGE_unfiltered’. For each sample, you should have the following 3 files: clonotype_frequency.tsv, barcode_report.tsv and either bcr_annotation_airr.tsv or tcr_annotation_airr.tsv. The bcr_contigs.fa or tcr_contigs.fa files are not required and will be ignored. Note that the all-samples unfiltered count matrices are not currently supported.
- For immune data without WT parent data, you should upload the filtered immune data. The immune files are stored in the pipeline outputs folder entitled ‘immune_output_combined’. You can drag and drop a single folder. For each sample, Trailmaker will select the filtered count matrices stored in ‘DGE_filtered’. For each sample, you should have the following 3 files: clonotype_frequency.tsv, barcode_report.tsv and either bcr_annotation_airr.tsv or tcr_annotation_airr.tsv. The bcr_contigs.fa or tcr_contigs.fa files are not required and will be ignored. Note that the all-samples filtered count matrices are not currently supported.
- For 10x Chromium count matrices that are output from Cell Ranger, we recommend uploading the unfiltered count matrices that can be found in the folders entitled ‘raw_bc_matrix’. You should have 3 data files per sample: barcodes.tsv; features.tsv or genes.tsv and matrix.mtx. The files are usually in gzip format i.e. ending in .gz. The files should be uploaded within folders that are named with the sample names.
- Data generated using BD Rhapsody in the expression_data.st file format. The zip files that are output by the primary processing pipeline contain the .st files that should be uploaded and they must be unzipped first. The folder with Multiplet and Undetermined cells should not be uploaded since it would distort the analysis. Note that AbSeq data is filtered out by default. After uploading your data, you can elect to include AbSeq data by checking the box in the Project Details page. Support for AbSeq is currently for visualization purposes only, as experiment-wide normalization will be slightly skewed. In case there is AbSeq data in your experiment, we suggest you create two projects; one including AbSeq data and one without, and compare the results.
- Seurat objects in the .rds file format generated using Seurat v4 or v5. There is a size limit of 15GB for Seurat objects. If the .rds file size is over 15GB, try removing any assays not indicated in the list of requirements below. Ensure the default dimensionality reduction in your Seurat object is named exactly umap or tsne. If the default reduction name includes umap or tsne (e.g., ref.umap), it will be automatically renamed. If the default reduction is different and does not contain these names, the upload will not be successful. The Seurat object must contain the following slots and metadata:
- scdata$samples: sample assignment. If absent, it will be treated as a single-sample experiment.
- scdata[['RNA']]@counts: raw feature counts
- scdata@reductions: contains the embeddings for pca, as well as either umap or tsne
- Note that cluster metadata in scdata@meta.data is auto-detected
- Note that sample level metadata in scdata@meta.data that groups samples in scdata$samples is auto-detected for downstream analysis
- Note that some cell-level metadata columns may not be available in Trailmaker: columns with very high cardinality and where more than one-third of the entries occur fewer than four times are filtered out
- Note that only a single Seurat object (.rds file) can be uploaded to a project. It is not possible to integrate multiple Seurat objects in Trailmaker.
- H5 files in the matrix.h5 file format, such as those output from Cell Ranger. [Note that H5AD files are different to H5 files, and are not currently compatible with Trailmaker. Files in .h5ad format can be converted into a Seurat-compatible format, for example following tutorials such as this:
https://mojaveazure.github.io/seurat-disk/articles/convert-anndata.html ] -
For guidance on how to handle other data formats not listed here, see the Unsupported data formats section .
Note that the only data size limitation in the Insights module is the 15GB file size limit for Seurat objects in the .rds file format. There are no limits to the number of projects or size of data files or samples that can be uploaded to this module.
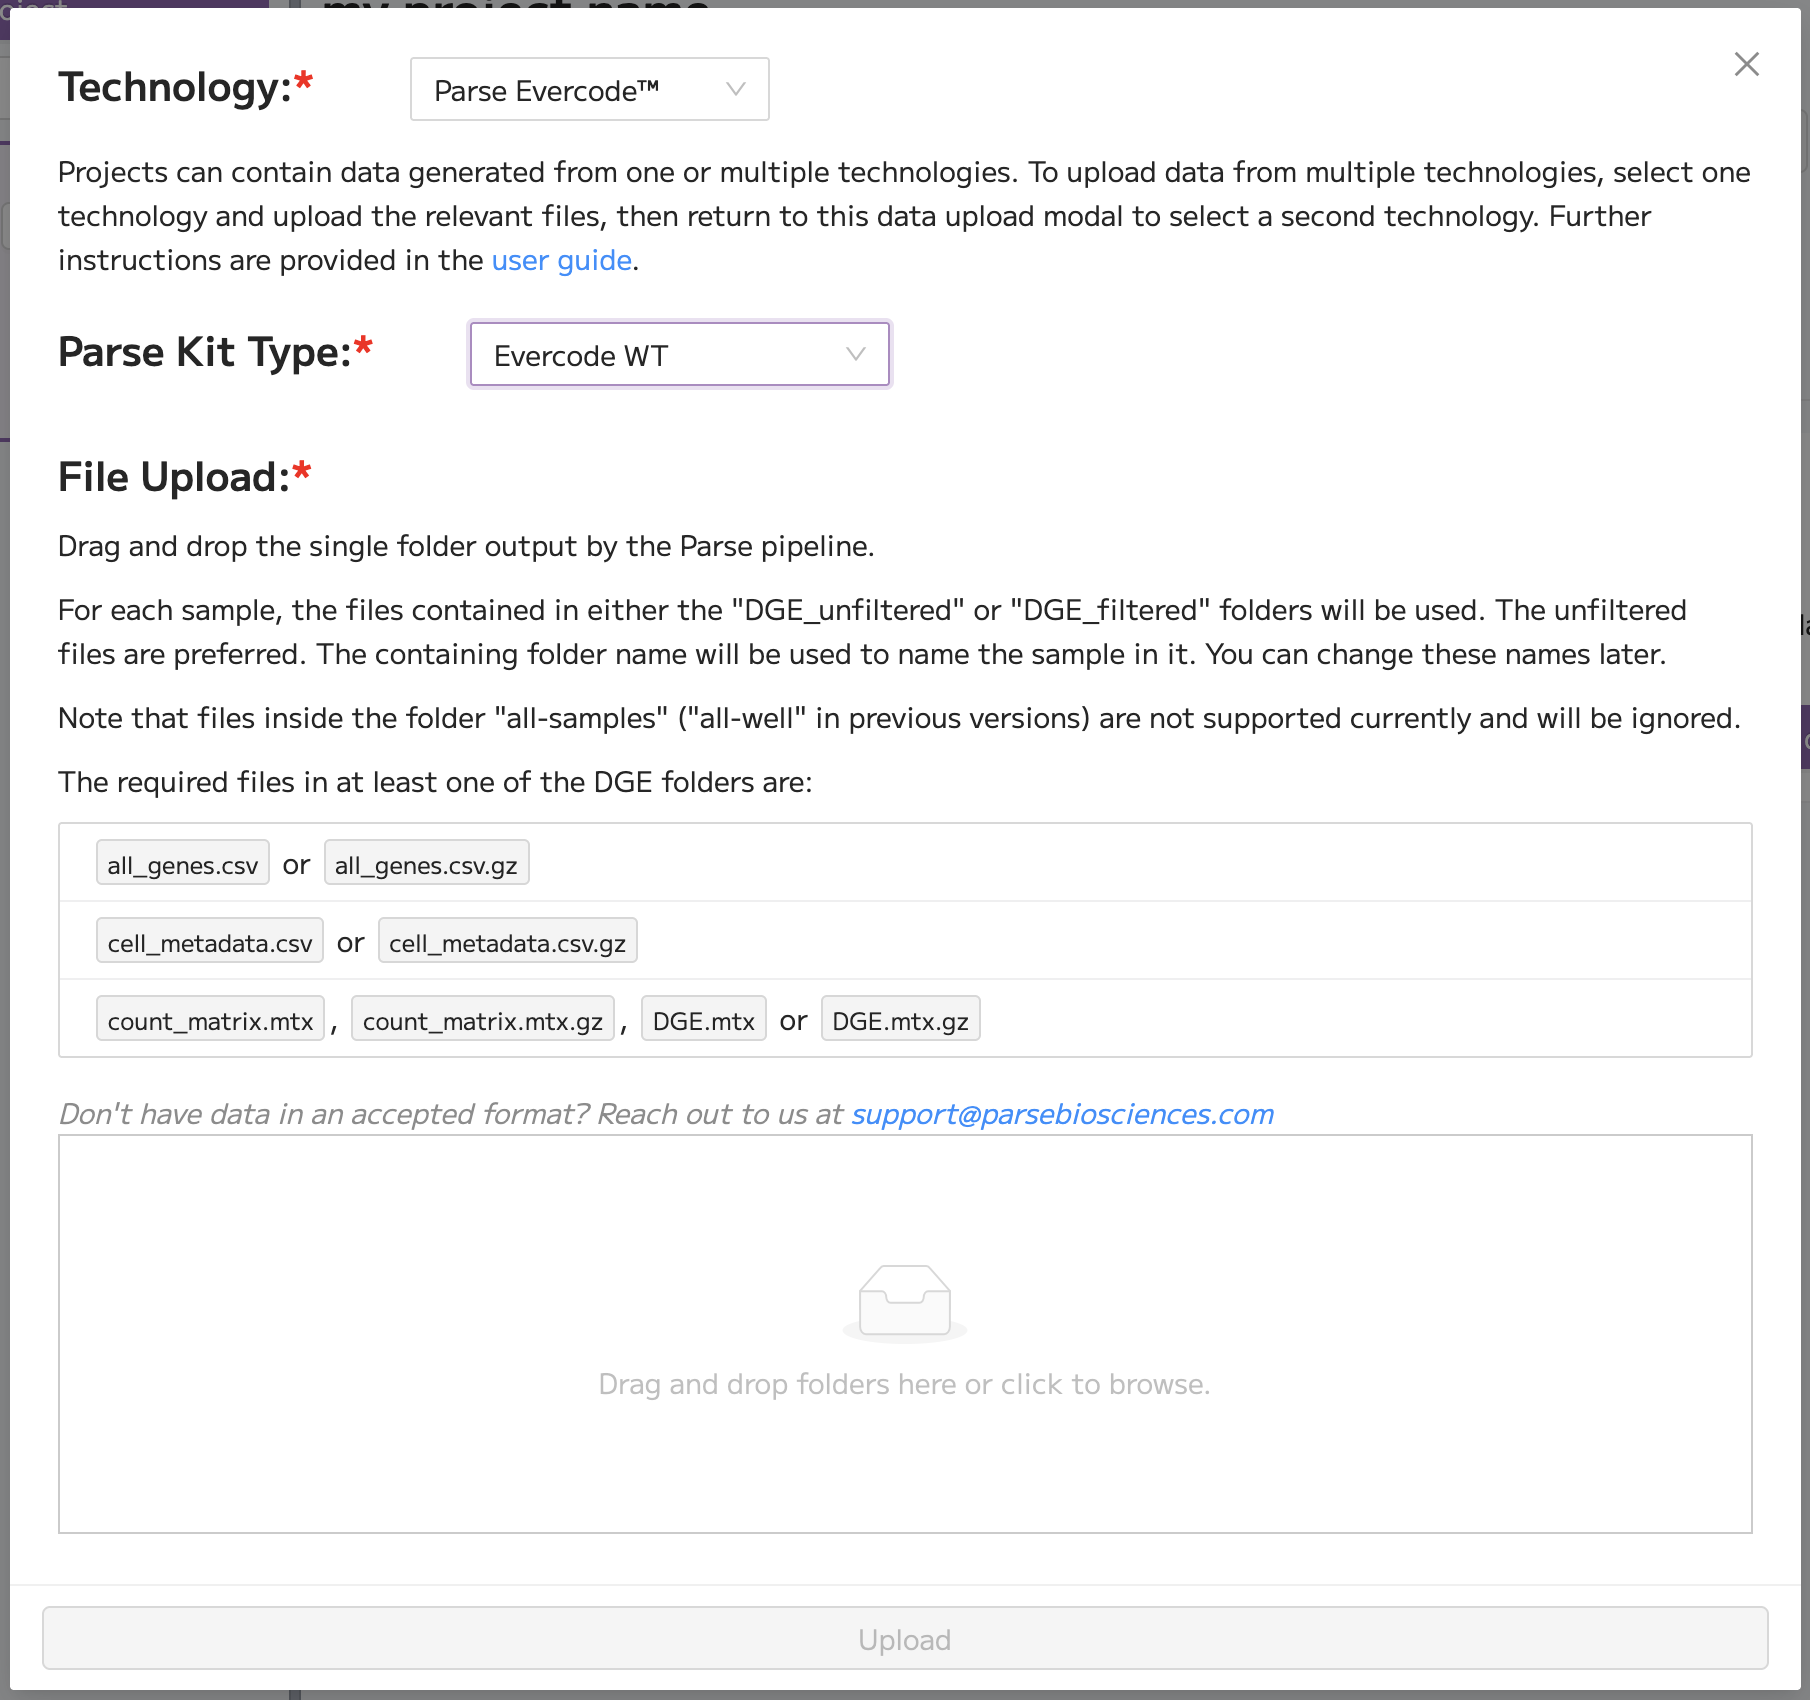
For Parse Biosciences Evercode Technology, it is necessary to specify the kit type in the Parse Kit Type section:
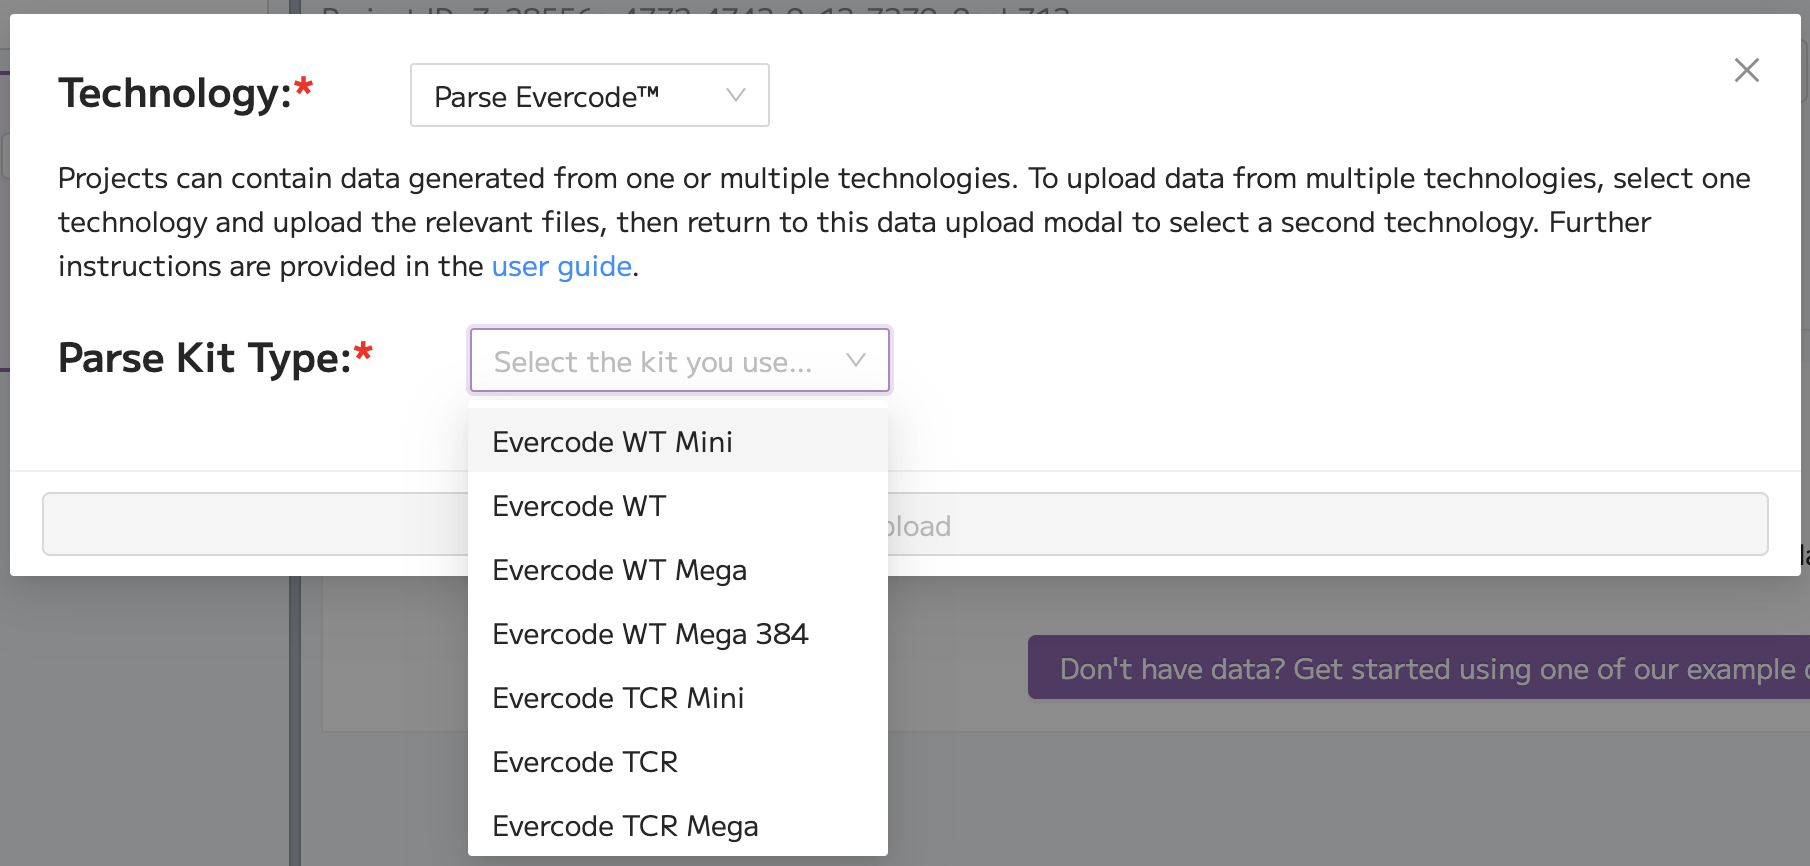
When kit type is selected, the relevant instructions for file upload are displayed on the modal.
The kit type is used to optimize some Data Processing settings within the Insights module, such as the calculation of the knee threshold in the cell size distribution filter (filter 2) and the calculation of the doublet scores (filter 5). See Step 5: Doublet filter for more details.
An example screenshot is shown below, with Parse Kit Type selected as 'Evercode WT'. You can proceed with file upload. The required files are listed on screen.
When an Evercode WT kit is selected, the FFPE option is available. The toggle should be set to 'on' if the samples have been processed using an Evercode WT FFPE kit.
A second example screenshot is shown below, with Parse Kit Type selected as 'Evercode TCR'. For immune data, you must select whether you have WT parent data using the toggle button in the Immune Data Type section. Then, you can proceed with file upload. The required files are listed on screen.
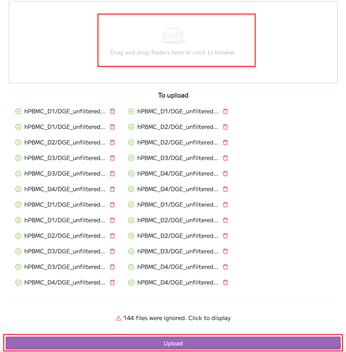
To upload data, simply drag and drop it into the box(es) in the File Upload section. You can remove unwanted files using the delete icon that appears next to each file. Select ‘Upload’ to begin uploading the files. Note that multiple samples can easily be uploaded at the same time.
The files will be compressed (if not yet so) before uploading. You can see the status of the upload for each file from the upload bar. Files that are getting compressed appear in orange. Successfully uploaded files appear in green. Files that fail to upload will show in red. Examples of these file upload statuses are shown below:
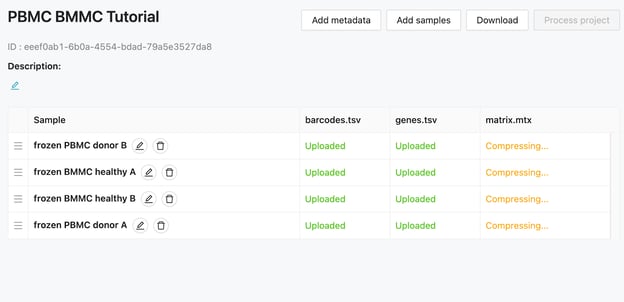
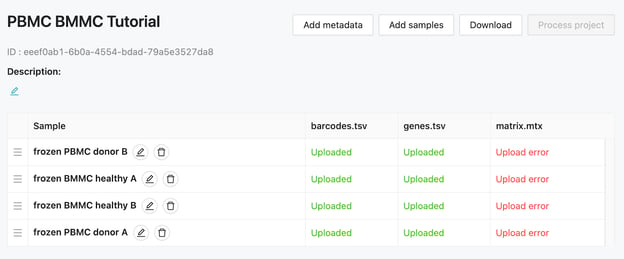
You can click on the “Uploaded” or “Upload error” text of the specific sample to see the details of the file. In the case of a successful upload, you will be able to download or replace the file. In case of a failed upload, the modal will show options to retry the upload or replace the file.
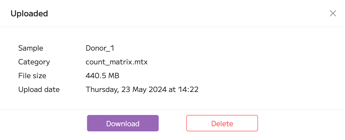
For WT data uploaded as count matrices, multiple technologies (specifically Parse Biosciences Evercode and 10x Chromium) can be uploaded and integrated in a single project.
To upload data generated using multiple technologies, start by selecting one technology type in the dropdown menu and upload the relevant data files. Then, click 'Add data' from the Project details page again.
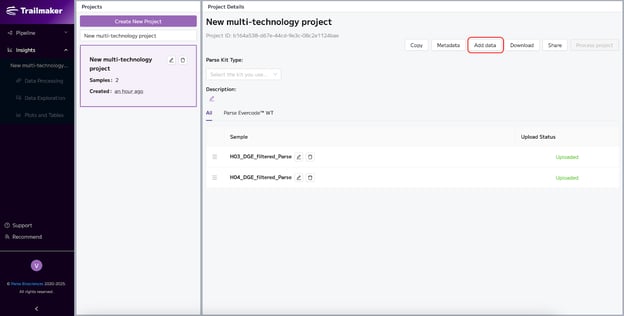
On the second visit to the data upload modal, select the second technology type from the dropdown menu and upload the second set of data files. The Project Details page will then display all samples in the 'All' tab of the samples table:
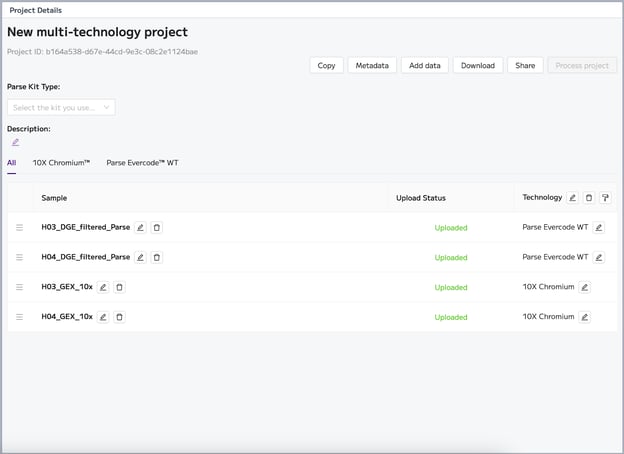
By selecting an individual technology tab, e.g. Parse Evercode WT, you can view the data files and upload status for all samples of the selected technology:
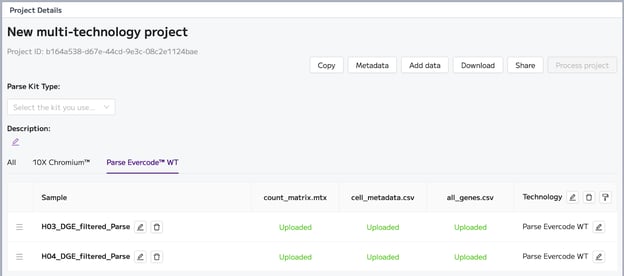
Note that technology is automatically added as sample-level metadata for multi-technology projects. This means that data can be explored and plotted per technology in the other pages within Trailmaker Insights module.
Further information and considerations for analyzing multi-technology projects is available here: How to integrate Parse Evercode and droplet-based data for analysis in Trailmaker.
Once sample files have been uploaded to your project, you can re-order samples in the sample list. Drag the sample to the desired position by using the button (3 lines) on the left of the sample name. The sample order on this page determines the order that samples appear in the other modules of Trailmaker. Sample order can also be changed later in Data Exploration. Sample names can also be changed after upload.
Adding metadata
The addition of metadata is important for multi-sample experiments in order to assign samples to groups. For example, samples within a dataset could be assigned as “control” and “treated”; or “healthy” and “disease”. Assigning metadata will then allow the comparison of groups to determine differentially expressed genes (e.g. to calculate differentially expressed in genes in a cluster of interest comparing two groups) and visualization of groups (e.g. a dot plot showing the expression of multiple genes of interest across two or more groups) further downstream in the platform. Samples can be assigned to multiple metadata groups.
Sample-level metadata
Sample-level metadata provides context about the sample as a whole, with details like the biological source (organism, tissue, cell types), experimental conditions (treatment, disease, etc.) or collection datetimes (in time-course studies). Sample-level metadata is usually defined during the experimental design, and known a priori.
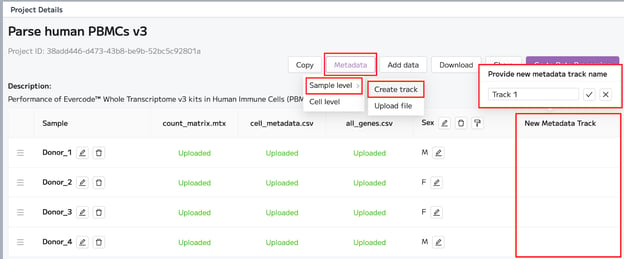
Once the samples are uploaded, you can add metadata to the samples by clicking the “Metadata” button, followed by “Sample level” and “Create track”. You will be asked to name the “metadata track”. This results in a column being added to the sample information table. Metadata can be assigned to each sample. There is no limit to the number of metadata tracks that you can add.
For example, you might label the metadata track “Treatment” and assign each sample as “control” or “treated”. Alternatively, you might label the metadata track “Tissue” and assign each sample as “blood” or “skin”. There is no limit to the number of metadata tracks that you can add to a project.
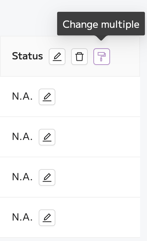
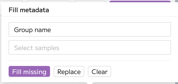
When a metadata track is created in the Project Details page, the paint roller icon can be used to insert or change the metadata value for multiple samples at the same time. Clicking the paint roller icon (left screenshot below) opens the Fill metadata popup (right screenshot below). In the Fill metadata popup, the group name can be inserted into the first box, and the samples selected in the second box. This tool is particularly useful for assigning sample level metadata to projects with many samples.
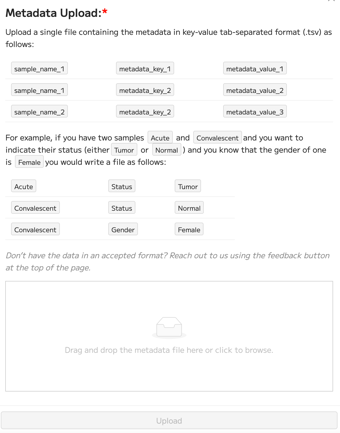
Alternatively, clicking “Metadata”, then “Sample level” and “Upload file” allows you to upload sample-level metadata in bulk in the form of a tab-separated (.tsv) file. Note that a .tsv file can easily be exported from Excel or Google Sheets. Note that Mac users of Excel may need to export as .txt and then manually change the extension to .tsv.
Automatic sample-level metadata: In the following cases, Trailmaker will automatically create a column of sample-level metadata:
- Where a project contains a mixture of samples generated using multiple technologies, a "Technology" column is created automatically.
- Where a project contains a mixture of FFPE and non-FFPE samples, an "FFPE" column is created automatically.
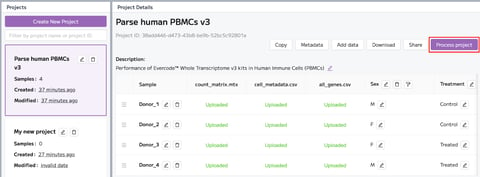
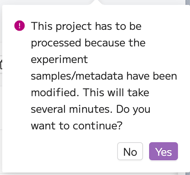
Once all the metadata has been inserted, click on “Process project” and confirm by clicking “Yes”. This will launch your data analysis.
Cell-level metadata
Cell-level metadata is specific to individual cells, and usually includes information that is variable from cell to cell, such as the cell type and subtypes, measures for different quality metrics (read counts per cell, number of genes, proportion of mitochondrial genes, etc), information about cell cycle stage, clustering assignment, among others. Cell-level metadata is usually generated by processing the data, by running different types of analyses whose output is a different value for each cell, irrespective of the sample that they belong to.
You can upload cell-level metadata to trailmaker by clicking on the “Metadata” button followed by the “Cell-level”. A modal will open where you can drag and drop your cell-level metadata .tsv file. Note that .tsv file format can easily be exported from Excel.
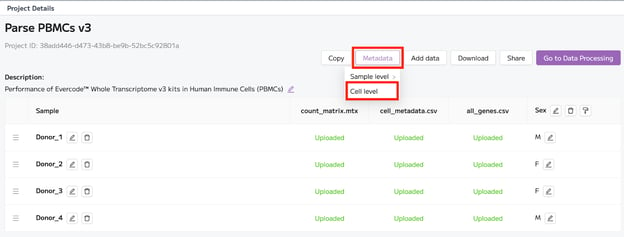
The file must be structured as a tidy, long format table. That is, each row should contain the information for a single cell, with each variable (cell type, cell subtype, proportion of mitochondrial content) as a column, as shown in the following screenshot.
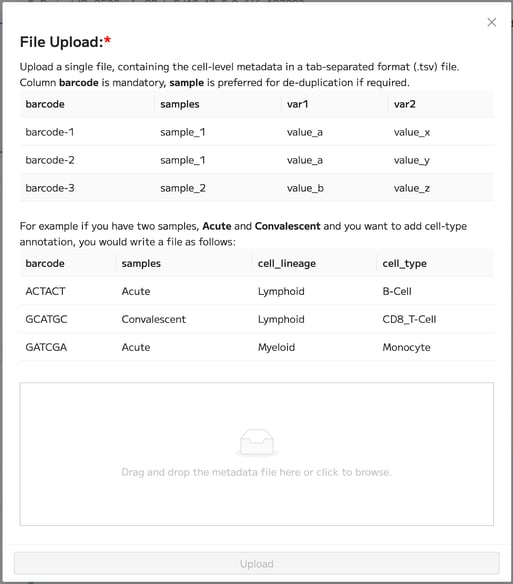
The ‘barcode’ column is mandatory, that is the cell identification, which allows correctly matching values in the table with corresponding cells. In addition, a ‘sample’ column is highly recommended, in case there are duplicate barcodes between samples. If there is no sample column in the uploaded table, and there are duplicate barcodes, no metadata will be added to those cells (because there is no way to ensure that the data belongs to one cell or other).
Note that Trailmaker automatically filters out metadata columns that aren't good candidates for cell-level cell sets, meaning that some columns may not appear in downstream analysis modules in the platform. Cell-level metadata columns with very high cardinality (too many unique values) are excluded, as are columns where more than one-third of the entries occur fewer than four times (i.e., too many rare values). If a column is filtered out, the file upload still succeeds, but that column won't be available in the Data Exploration or Plots and Tables modules for creating cell sets, visualising plots or performing differential expression comparisons.
Note: it is not possible to add cell-level metadata to immune (TCR or BCR) projects without WT parent data.
Launching an Insights project analysis
Clicking on the “Process project” button initiates Data Processing.
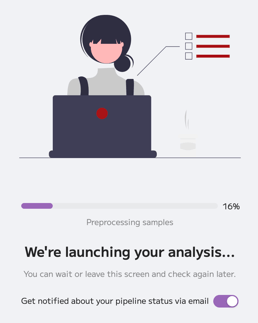
The first step of this process is that count matrices are converted into an individual Seurat object for each sample in the project. Sample names and metadata that were input in the Insights module Project Details page are inserted into the Seurat object. The progress of this conversion process is displayed to the user. This step might take some time for large datasets, so you can opt to get notified via email once this step is completed and leave the screen.
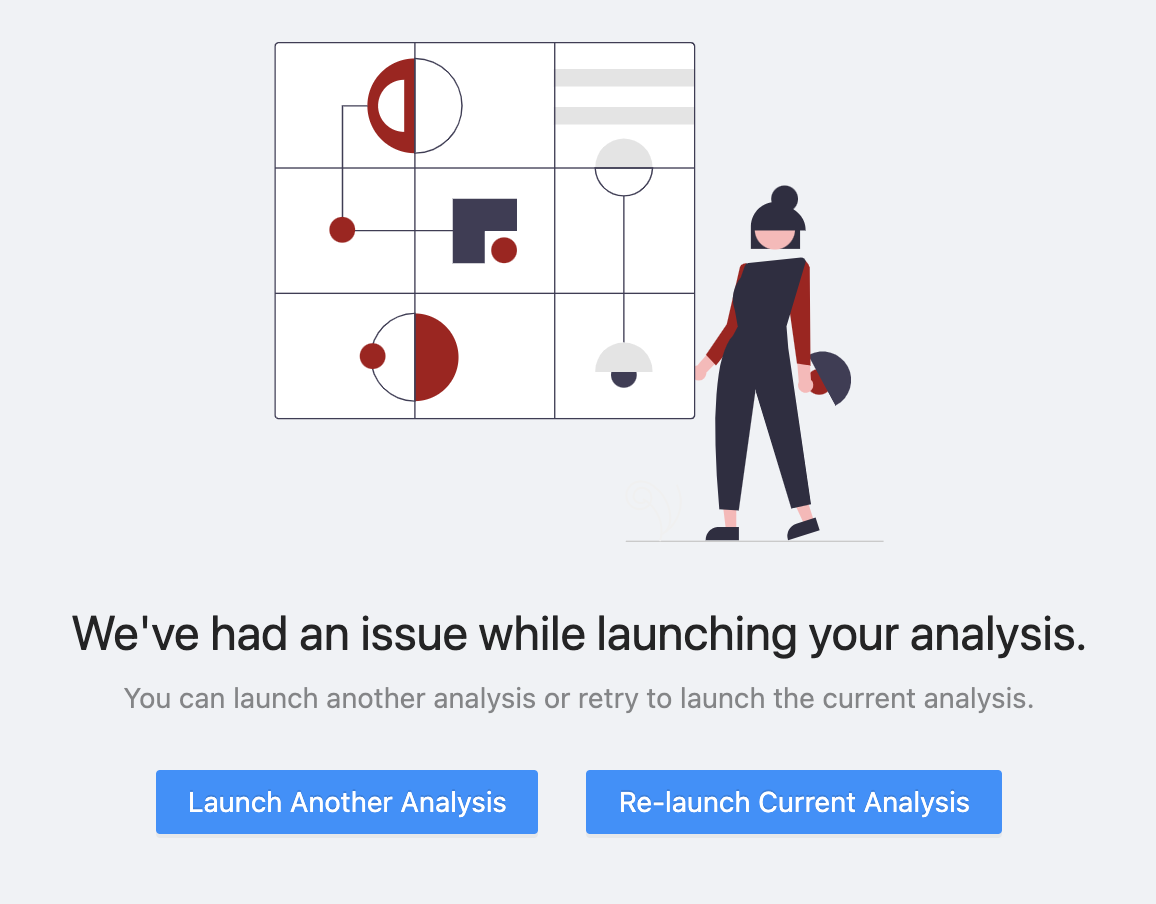
If this conversion step fails, you will see an error screen like the one below. You can try to re-run the process, or return to Insights module project details page (click 'Insights') where you can edit the samples or data files in this project or you can choose to launch another analysis.
If this data conversion step completes successfully, Insights module Data Processing will be triggered automatically to run using our automatically determined settings. For more information, see the chapter of this user guide that’s dedicated to the Data Processing tab.
Share a project
Insights module Projects can be shared with colleagues or collaborators using the “Share” button in the Insights Project Details page (accessible by clicking 'Insights').
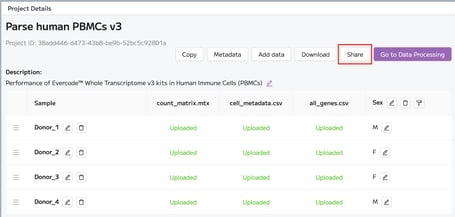
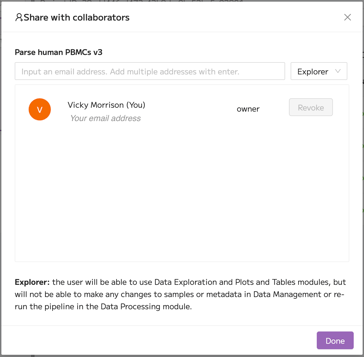
In the ‘Share’ modal, you can input the email address(es) of the individuals you want to share your Project with. Once the email address is inserted, you can assign the level of permission you are granting to that person, as either owner or explorer.
- Explorers can use Data Exploration and Plots and Tables pages, but will not be able to make any changes to samples or metadata or re-run Data Processing.
- There can be only one owner per Project. The owner has full control over the Project details, data files, samples and metadata, as well as running Data Processing. If you select another user as owner, you will be transferring ownership of that Project to the selected user. In doing so, you will lose all access to the Project.
Note that you can share with multiple other users at once by clicking ‘Enter’ after each email address. When all email addresses have been inserted and the level of permissions assigned, click ‘Done’.
Additionally, you can revoke access to the Project for specific collaborators in the same modal.
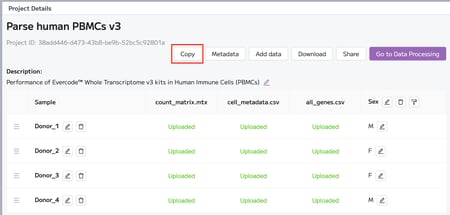
If the Explorer wants to create an independent copy of the Project so that they can control the Data Processing settings, they can do this using the ‘Copy’ button in the Insights Project Details page. The Explorer then becomes the Owner of the copied Project. Project owners should keep this functionality in mind when sharing Projects.
Note that any linked upstream analysis (related Run in the Pipeline module) to this Insights Project needs to be shared separately. To do this, navigate to the Pipeline module Run Details page.
See also: How to Share Data in Trailmaker.
Copy a project
The 'Copy' button in the Insights module Project Details page allows you to quickly and easily create a copy of an existing project. In doing so, you can create multiple versions of analysis of a dataset, for example, to compare different data processing settings side-by-side.
Click ‘Copy’ and a copy of your project automatically appears in your project list.
Downloading data from a project
All uploaded data files can be downloaded from the sample list view by clicking on the green ‘Uploaded’ text for each file.
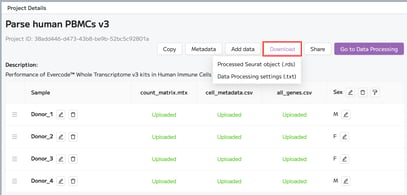
Additionally, the processed Seurat or Anndata (Scanpy) object can be downloaded using the ‘Download’ button at the top of the Project Details panel. For detailed explanation of the contents and format of the objects, see the following articles:
- Understanding the Seurat object that is downloadable from Trailmaker Insights module
- Understanding the AnnData (Scanpy) object that is downloadable from Trailmaker Insights module
The Insights module Data Processing settings (which contain the values for every parameter) can also be downloaded from here as a text (.txt) file.