
Key takeaways
- Sensitivity improvement in mouse brain samples
- More consistent gene detection
- Unbiased gene expression
More genes with less sequencing
Evercode WT v2 detected substantially more genes and transcripts in mouse brain samples compared to Evercode WT v1. To compare, nuclei were extracted from two different E18 mouse brain samples and prepared in parallel with Evercode WT v1 and Evercode WT v2. The gene detection plotted against sequencing depth for each product version is shown in Figure 1. At 100,000 reads/cell, Evercode WT v2 detected 37% more genes per cell than Evercode WT v1. The improved sensitivity can reveal more biology per experiment or reduce sequencing needs.
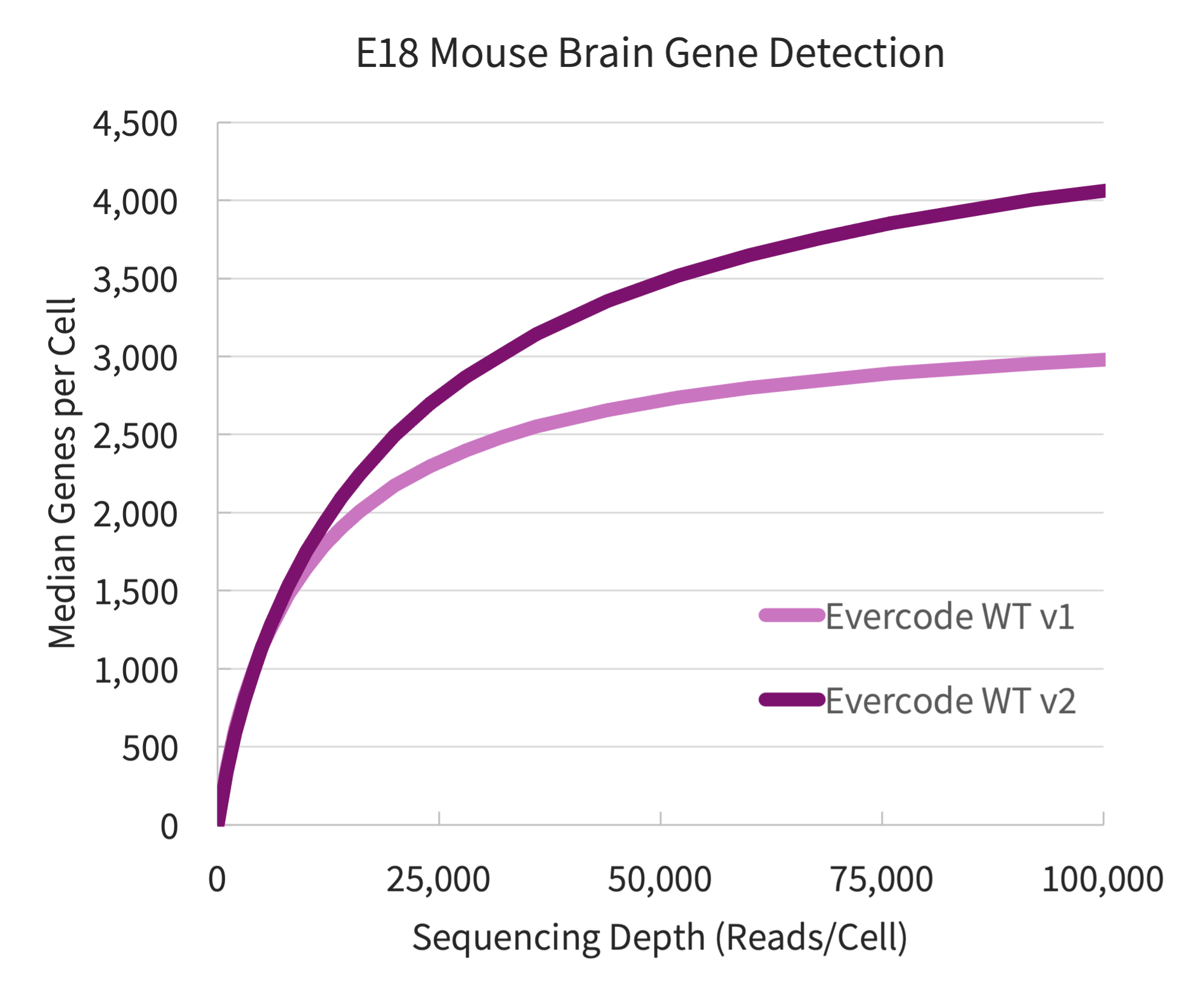 Figure 1. Gene Detection for E18 Mouse Brain Nuclei. Gene detection from E18 mouse brain samples prepared in parallel with Evercode WT v1 and Evercode WT v2. A sublibrary from each experiment was sequenced and processed using the Parse Biosciences data analysis pipeline.
More consistent gene detection
Consistent gene detection between samples results in fewer sample failures, more predictable sequencing planning , and straightforward data analysis. The reproducibility and distribution of the genes per cell for Evercode WT v1 and Evercode WT v2 were plotted (Figure 2). The medians were more consistent across samples and tighter distributions are seen in the Evercode WT v2 results.
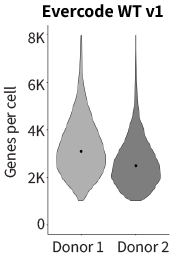
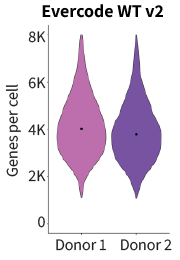
Figure 2. Gene Detection Across Samples for E18 Mouse Brain Nuclei. Violin plot showing the number of detected genes per mouse brain donor for Evercode WT v1 (left) and Evercode WT v2 (right). The dot (black) denotes the median genes detected per donor.
Unbiased gene expression
Gene correlation plots confirm unbiased gene expression of the E18 mouse brain samples prepared with Evercode WT v1 and Evercode WT v2 (r2=0.989 for donor 1, r2=0.972 for donor 2) (Figure 3).
Researchers can transition to Evercode Whole Transcriptome v2 kits to benefit from greater gene sensitivity, improved sample robustness and lower multiplet rates, while integrating data with other studies.
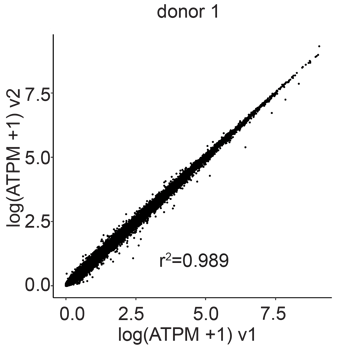
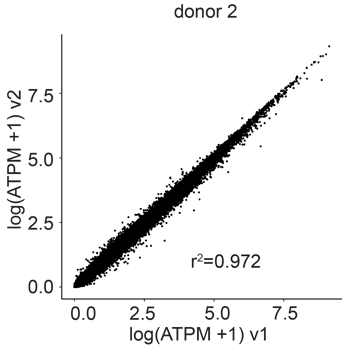
Figure 3: Gene Expression Correlation Between Evercode WT v2 and Evercode WT v1 in E18 Mouse Brain Nuclei. The average gene expression (log average transcripts per million) between the Evercode WT v2 and Evercode WT v1 results was compared for each of the individual donors. The r2 values indicate a high degree of correlation in gene expression between the Evercode WT chemistry versions.
Next Steps
- Download the data files generated from the preparation and analysis of the E18 mouse brain nuclei samples. These datasets include the experimental summary report, the digital gene matrix file, the cell metadata file, and genes file.
-
Explore more by reviewing the full experimental plan and detailed results across multiple sample types in the bioRxiv paper.